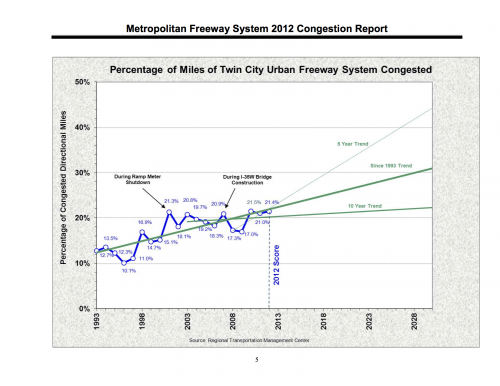
Percentage of Miles of Twin City Urban Freeway System Congestion. Source: Metropolitan Freeway System 2012 Congestion Report
This graph shows the percentage of congested directional miles on the MnDOT managed freeway system for the Twin Cities metro area, from the Metropolitan Freeway System 2012 Congestion Report. The trend lines show the difficulties with extrapolation, as choosing different bases will produce widely different trends. The 10 year trend is essentially flat, projecting a 2030 value the same as today, while the five year trend (which starts at the nadir of the recession) projects huge increases.
