Chart of the Day: US Cities by Percent of Population Biking to Work

Chart showing the percentage of residents commuting to work by bike for US cities with population greater than 100,000 people.

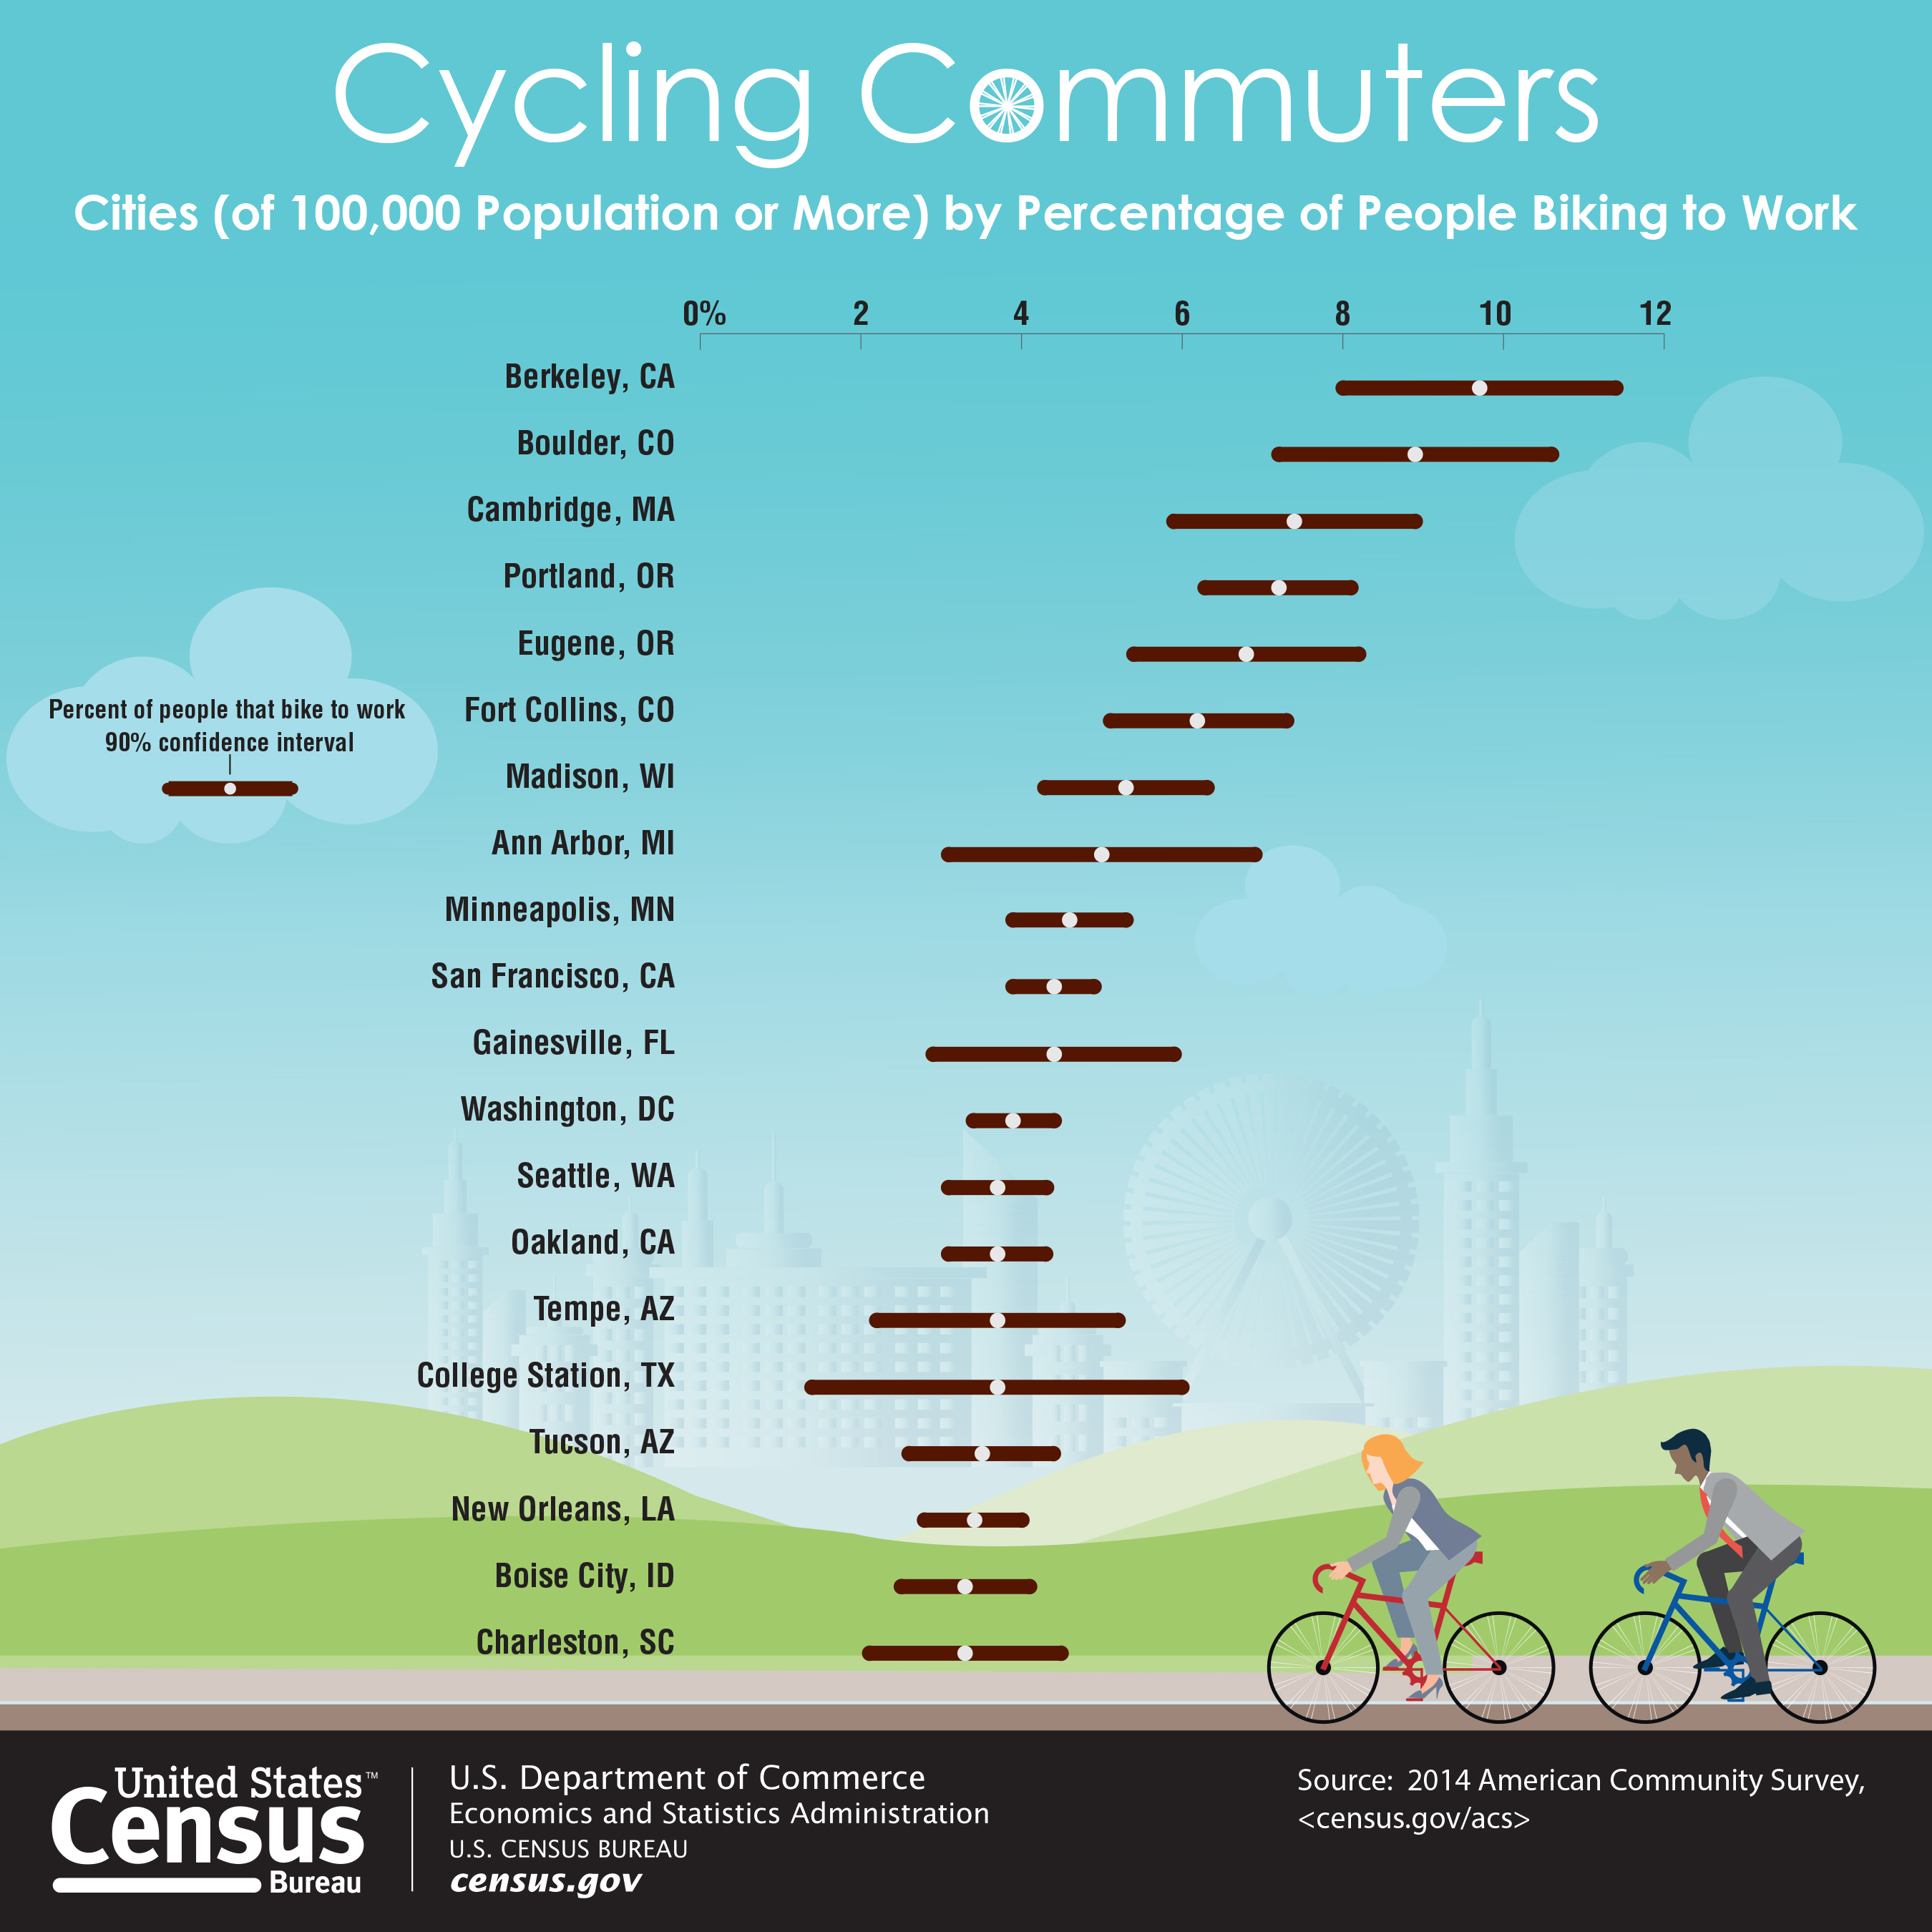
US Census: Percentage of people commuting to work by bike, for US cities with population greater than 100,000 persons. Credit: US Census Bureau.

More information (and high resolution image) at https://www.census.gov/newsroom/press-releases/2016/cb16-tps96.html

Antonio Rosell

About Antonio Rosell

Antonio M. Rosell, P.E., AICP is founder and Director of Community Design Group (CDG), a consulting firm specializing in pedestrian and bicycle planning, placemaking and urban design, and community engagement. Although he doesn't very often write for Streets.MN, he might start doing so soon (very soon!). In the meantime, you can find him (occasionally) at @comdesgrp.

6 thoughts on “Chart of the Day: US Cities by Percent of Population Biking to Work

  1. Aaron

    Here’s an important caveat – I believe the ACS question they’re referring to here is not a very good measure of how many people bicycle to work over the course of a year.

    31. How did this person usually get to work LAST WEEK? If this person usually used more than one method of transportation during the trip, mark (X) the box of the one used for most of the distance

    [ ] Car, truck, or van
    [ ] Bus or trolley bus
    [ ] Streetcar or trolley car
    [ ] Subway or elevated
    [ ] Railroad
    [ ] Ferryboat
    [ ] Taxicab
    [ ] Motorcycle
    [ ] Bicycle
    [ ] Walked
    [ ] Worked at home -> SKIP to question 38a
    [ ] Other method
    [J] – Answer question 32 if you marked “car, truck or van” in question 31. Otherwise, SKIP to question 33.

    There are two key words that are worth pointing out – (1) “usually” and (2) “LAST WEEK.” So this actually measures how many people *primarily* commuted by bicycle. And because the ACS is taken year round, the “LAST WEEK” language particularly disadvantages Minneapolis, the coldest major city on this list by some margin.

    I’ve been working on a forthcoming report that looks at how many people bicycle to work at least occasionally in the seven-county metropolitan area. From the data we collected, it looks like approximately 13.4% of 20-64 year old metro area residents meet a *minimum* threshold of bicycling to work “less than once a week” (or more often) during “warm weather months” (April through September), with our confidence interval running from 9.5% to 17.5%. That’s for the 7-county metro area, not just the city of Minneapolis.

    To be fair, this is a more expansive definition of biking to work, using a narrower slice of the population (working age adults). The other cities on this chart would also see a larger share of their populations bicycling to work using a different definition. But what I think it adds is demonstrating that the constituency for bicycling infrastructure is much broader than the 4.5% or so of the population of the city that bicycles to work 3-5 days of the week before they took the ACS.

    1. Morgan

      The more recent an event or activity the more reliably one remembers it. This is standard data collection.

      1. Aaron

        Of course I agree with this, but recall is not much of an issue for distinguishing between somebody who rides to work at least occasionally versus somebody who never rides to work. Social desirability could lead people to report bicycling that never happened, but I doubt anybody would mistakenly recall biking to work when they never did.

    2. jeffk

      That’s interesting. I’m usually the first to favor data over anecdotes, but in my 11 years of biking around Minneapolis, I’ve seen that same 4% number quoted the entire time while I’d swear the number of bikers I see has quadrupled.

  2. Eric SaathoffEric Saathoff

    I think it’s important to measure total population versus university population. College towns are at an advantage here.

Comments are closed.