Build More Housing: The Big Picture

Neighborhoods are designed, slowly and constantly, by the people who live in them. We make decisions about what gets built and who gets to use it or live in it through a network of community meetings, zoning boards, and city and state governments. In the process we create something we call “housing policy”. I have participated in a number of these discussions since moving to St. Paul, and they almost always focus on the details of a proposed building: how tall, what color, how many parking spaces, etc. Of course, I understand why: when designing and building homes that people will live in for a long time, it’s important to get the details right. The way a neighborhood or a city grows and changes is influenced by what gets built, so it’s natural that people want to have a say in what kind of housing is built near them.

But if we only ever focus on the height of a particular building or whether it’s made of brick or concrete, we might miss the big-picture forces that shape our city and ignore economic trends that are hurting many of our neighbors. So for a moment I’d like to set aside the details and zoom out to tell a story about what has happened in the Minneapolis-St. Paul metropolitan area over the past decade. The same trends have affected many other American cities, and I see no signs that these trends will cease over the next decade, perhaps excepting temporary slowdowns during the Covid-19 pandemic.

I would like to make one very simple argument. It’s something that many of my friends and neighbors understand intuitively, but it’s surprising to me that I don’t think I’ve ever seen it presented simply by elected officials or journalists.

Since 2009, the Twin Cities metro area has not added enough homes for the people who want to move here. The Twin Cities is a desirable place to live for many reasons, most prominently its strong job growth over the last decade. That increase in demand for housing without the supply to match it is the overwhelming reason why the cost of housing has increased every year since I’ve lived here. If we fail to build enough housing to meet demand for it, we should expect rents to continue to rise throughout the metro.

Discussing changes in housing, population, or jobs are essentially exercises in counting things, and of course sometimes the answers depend on how you count. For this article, I’m relying on data published by the U.S. Census Bureau and Bureau of Labor Statistics. Year-by-year estimates for population and housing units at the county level are available at the Census website. For job counts, I used the Quarterly Census of Employment and Wages provided by the Bureau of Labor Statistics. All of these numbers use the Seven-County Metro Area, an informal but widely-used grouping of Minneapolis, St. Paul, and their surrounding suburbs.

I should note here that I’m just a software developer with no formal experience in geography, statistics, or public policy. I did have friends with more specific expertise read drafts of this post, and I welcome corrections or notes on whether I’m using this data appropriately.

I’m using 2009 as the starting point of my analysis because it marked the end of the Great Recession (at least in terms of GDP) and started a decade of consistent population and job growth in the Twin Cities. The reasons why we’ve added so many jobs aren’t really important to my argument here, but my attempt at a summary explanation is that the Twin Cities benefits from a highly educated population, strong roots in growing healthcare and tech industries, and long-term trends toward urbanization across the US. The parks, lakes, and rivers are also quite nice, as long as you can tolerate the weather.

So let’s take a look at how the seven-county Minneapolis metro area has grown since 2009, in terms of people and housing units:

A Google Docs graph with two lines showing the change in population and the change in number of housing units in the Minneapolis metro area since 2009. Both lines increase over time, but the population line increases substantially more than the housing line

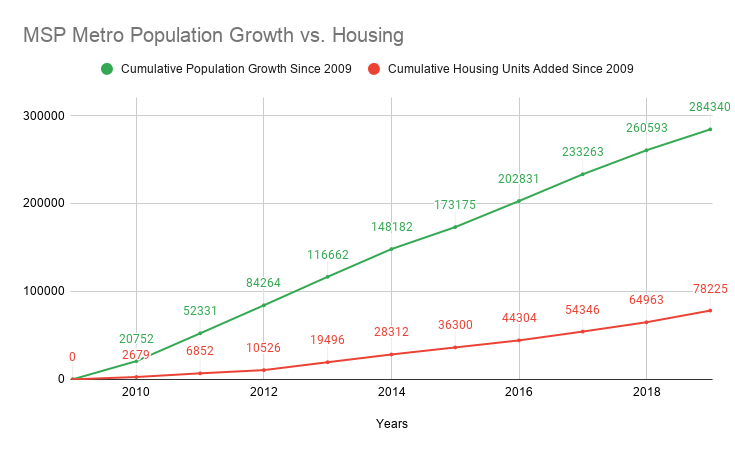
From 2009-2019, the Twin Cities grew by 284340 people and added 78,225 houses or apartments in which to house them, nearly a 4:1 ratio of new people to new homes. That seems, well, like not enough housing, unless every last person who moved here is living double-bunked in a 2-bedroom apartment. Population growth can happen in lots of different ways, though – newborn babies have different housing needs than young professionals or retirees – so let’s also look at job growth in that same time period as a measure of housing demand independent of family size. Generally speaking, every new job will correspond with a new person who wants to live in the area, either by themselves or with their family.

A Google Docs graph with two lines showing the change in jobs and the change in number of housing units in the Minneapolis metro area since 2009. Both lines increase over time, but the jobs line increases substantially more than the housing line

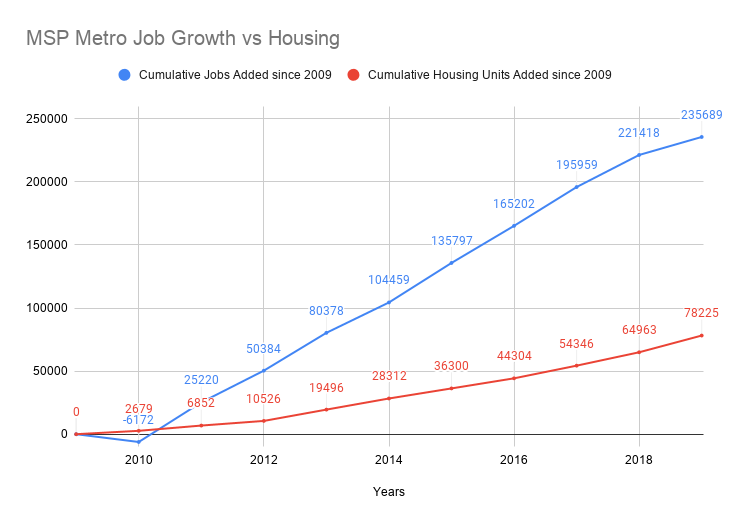
Okay, yep. That graph looks very similar. We’ve added 235,000 jobs to the metro area in the last decade, and the gap between added jobs and added housing seems to be growing larger.

This is the part where I say that when demand for a Thing increases and the supply of that Thing is not increased to match, the Thing becomes more expensive. Do I need to elaborate further, in a year where we have all seen this dynamic play out across a wide array of product categories? If you’ve tried to buy a bicycle or a rowing machine or a Playstation or a computer graphics card or a bag of flour or a case of toilet paper this year, you may have come to a situation where you had to choose between paying more than you otherwise would, or going without. Housing is a market like any other, with a variety of potential buyers and sellers, and it’s subject to market forces. If we have a desirable place to live and we don’t build enough living places, we should expect the cost of a home in our city to continue to rise.

A Google Docs graph showing the growth in Median Gross Rent in the Minneapolis Metro Statistical Area since 2009. The median rent increases every year in the time period, starting at 845 and increasing to 1144 by 2019

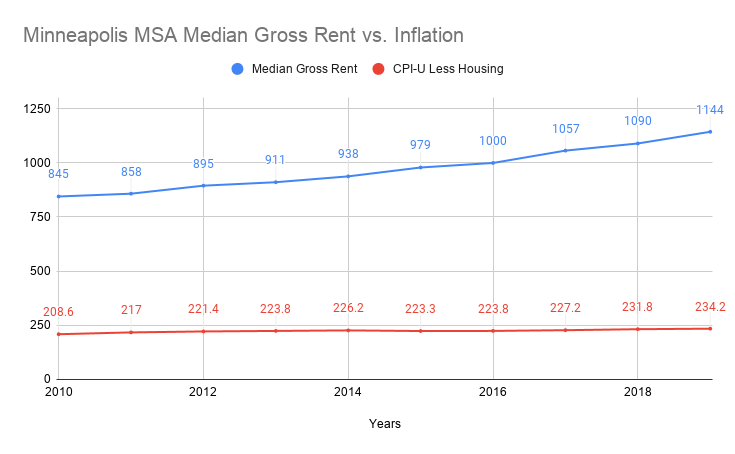
I could only find median gross rent for the Minneapolis Metropolitan Statistical Area, which is a larger zone than the seven-county metro, but I think it’s a useful way to illustrate the overall trend. Median rent has gone from $845 to $1,144 from 2010 to 2019, a 35% increase. I also plotted the national CPI-U (Consumer Price Index for All Urban Consumers) with housing costs removed, which only increased by 12% during the same time period. The price of housing has gone up a lot, and much more than the price of most other things we buy.

These rent numbers are metro-wide averages, so it’s safe to say that rents in the most desirable parts of Minneapolis and St. Paul have gone up even more. If anything, these numbers look tame compared to what’s happened to San Fransisco, Austin, or Seattle over the same timeframe, but these rent increases do incredible harm to people who find themselves priced out of their homes if their income doesn’t increase to match rising rents. Research on the relationship between housing prices and homelessness consistently shows that when homes become more expensive, more people end up unhoused.

I think it’s very important for the current citizens of desirable American cities to recognize and fight these trends by advocating for the construction of more homes. Most U.S. cities have inherited zoning codes created in more racist, classist, and exclusionary times than our own that continue to shape how our cities grow. We need more homes of many different shapes and sizes to help our cities grow to their full potential and help as many people as possible thrive within them. I’m happy to participate in discussion about how best to encourage growth that is humane and sustainable, but I think that discussion must start with a shared understanding of why housing is becoming unaffordable in American cities: a consistent, widespread lack of supply.

That’s what I mean when I say “Build More Housing”.

NOTES:

20 thoughts on “Build More Housing: The Big Picture

  1. Ted

    Seems that beyond just building more housing the thing I’m seeing in my neighborhood (Kenny) is that not only are many neighbors against duplexes and triplexes there has been a rapid trend to take $300K houses and double their square footage and occasionally triple their prices. Sure housing prices have gone up everywhere, but on top of that the so-called “starter home” barely exists around here anymore forever locking certain income brackets out of home ownership here. I understand that many (who have the means) prefer to add a story onto their existing homes rather than move to a nearby suburb where McMansions are the norm, but I think we are missing the reality of how that changes neighborhoods as a whole and the same who cry out against zoning changes nearby would be irate should the city get more strict about single family home building permits.

    1. Dan MarshallDan Marshall

      This is kinda a whatabout argument which is tangential to the point of the article. Wealthy people making their single family homes bigger has more to do with the concentration of wealth toward the top 1% of of our society during the past two decades and doesn’t really relate to MSP’s housing crisis affecting the other 99%.

      1. Ted

        Hmm, I didn’t mean to say that the author was wrong that we have a housing shortage problem (we certainly do), but I was suggesting that simply increasing availability isn’t going to do much if everything is luxury condos and 2500 square foot single family homes. I applaud the move to allow for building more Duplexes and Triplexes in hopes that may make rent or purchasing more accessible while increasing density.

  2. Bill Mantis

    Interesting stats. Thanks for compiling them. The question that occurs to me: How fast would housing stock have to grow to ensure that housing costs rose no faster than the CPI?

    1. Ryan Ricard Post author

      If you use the same kind of napkin math that Anton used in the post linked in notes, for 284,340 people at an average household size of 2.32 you’d need about 122,560 housing units. So by that measure we’re 44,335 homes “behind” where we were in 2009.

      Another way to look at it would be to find cities that have built enough housing to keep rents flat while its population grew, the most prominent example I’m aware of is Tokyo: https://www.wsj.com/articles/what-housing-crisis-in-japan-home-prices-stay-flat-11554210002

  3. Bill LindekeBill Lindeke

    It’s wild to see that the Twin Cities has added almost an entire St. Paul of people in the last 10 years. Most people probably don’t understand that. I would have guessed a smaller number.

  4. Bob Roscoe

    I see studies like this occasionally. But everybody I know has bought or rents an existing house. To pay attention only to new housing and houses I think skews the big picture.

      1. Trademark

        Exactly, plus if we can lower the cost of living then more people will move here providing more taxable dollars and the ability to provide more public services like transit and the cycle will continue to grow

        1. Bruce Brunner

          As someone who builds and renovates multi family housing, the increases in the cost of building is rising much higher than income or just about anything else. A triplex I built 2 years ago is 15-20% more this year. Lumber is up 180%, there are labor shortages, delivery delays and more risk. The lots in MPLS are hard to come by and the 2040 plan to not make building multi family housing easier as they allowed SFH areas to have duplex/triplexes but the building has to be the same size so you lose a lot of the efficiencies of adding more density.

    1. Ryan Ricard Post author

      People have their own preferences on whether they’d rather live in a newer vs. older home, but if you’re moving to a city because of a new job, you’ve gotta live somewhere. Lack of new construction means there is more competition for the existing housing stock. What do you think we’d learn if we tracked the cost of homes built prior to 2009 over the past decade?

      1. Bruce Brunner

        I think you have a good point here. You have to live somewhere. Over the past 10 years over 75% of the new housing built has been in 100+ unit apartment buildings and at typically 75-100% higher rent prices than the 100 year old properties so lots of new people and a lot of people moving up to new places with a lot of amenities.

  5. Mike Hess

    Whenever I see these analysis of change over time it feels like the baseline conditions are not really considered. On the baseline, (thank you for making your data available), the ratio for the 7 county metro of total residents to total housing units at the start of your time period is 2.39 residents per housing unit. The ratio at the end, 2019, is 2.47 residents per housing unit – so on a relative basis, the seven county metro is 3% “denser” residents to homes. Similarly if you look at just Hennepin county (a poor surrogate for Minneapolis but it does jettison some of the farther out regions), the ratio at study start was 2.25 residents per housing unit, and it is now 2.32.

    So how does a region add people faster than homes and yet not change these overall ratios very much? Well apartment vacancy rates were about 6% at the start of 2009 and they (pre Pandemic) were below 4% so we ate into our vacancies (which contributes to the rental increase).

    Secondly after the recession led foreclosure crisis, and many home values plunged below their mortgage amounts, a lot of banks kept their properties off the market to avoid completely distorting the supply/demand curve and parceled them out over time…. so vacant homes (many were not rented out they were just sealed up) entered the market after 2009 not as new starts but they did support growth. We were seeing starts of 20,000 homes per year leading up to the great recession and there were as few as 4,500 at it’s worst.

    Lastly, these population numbers are not just adults – when an elderly couple or widow/widower downsizes from their home to move in with their kids or to a senior apartment, and a family relocating here for one of the jobs you cited, with a few kids in tow moves in to their house, that’s a net population increase without requiring new housing construction. An elderly couple or widow/widower rattling around in their old family home usually represents untapped housing capacity for a much larger family when the time to transition occurs.

    This is a nice report from 2014 on that that period that provides some interesting context. It’s a state level report and some of the examples come not from the 7 county metro but rather the bigger twin cities census based metro area. https://mhponline.org/images/stories/docs/research/reports/Uneven_Recovery_web.pdf

    That’s not to say we don’t need to build more housing – we do – and we need more variety of housing types, and the Mpls 2040 changes will help with that – but I think the tagline that we’re growing population 4 times faster than housing starts is missing important context.

    1. Evan RobertsEvan Roberts

      The average household size doesn’t change much as people adjust to a housing supply crunch, because the numbers of people moving into the region or moving due to changing circumstances (divorce, death, kids left home) are small relative to the size of the overall population. It’s the number of people moving (for whatever reason) relative to the number of homes that matters. Those ratios are much more sensitive to what seem like small changes in the total population.

      I’ll put it this way: looking at how average household size has changed to see if there’s much of a housing crunch is like looking at human growth with a population of children and adults. The average person probably isn’t growing much (maybe even shrinking a tiny amount!)

    2. Monte Castleman

      This latent capacity is something I’ve noticed. Across from me is a three bedroom house with one person living in it, her husband kicked out in a divorce and her daughter long since leaving the nest. The house next to that was one gentlemen that lived alone in a 4+ bedroom house until his kids moved him into a assisted living home. Two houses down a retired couple live in a massive old farmhouse on several acres of land. Even my sister and I probably have latent capacity in our house, although the third bedroom is now the home office; our house as many others a bedroom is the only reasonable place for the new essential, a home office.

      Some of these people have expressed the sentiment that “This is my home and I’m not leaving until the coroner carries me out”. And the older couple led the opposition to a redevelopment project that would have paid them well above market value for their home as well as my home and a few others. (I opposed the redevelopment too because at the time we had not yet bought the house and my parents were sending signals they’d sell it to the developer if he offered a “make me sell” price and then the two of us would be forced to move in with my parents or else find another house to live in) But eventually the coroner will carry out them and the two of us and the full capacity of houses will be back on the market.

  6. Monte Castleman

    A start would be to eliminate policies that cause an artificial scarcity in land supply like the MUSA line and minimum lot sized zoning.

    One thing to think about is that the “drive until you can afford it” become even more relevant in the post-COVID world where a once a day drive to the office might be a once a month drive, if that so living in Albert Lea with a job in Minneapolis becomes feasible which will basically add the entire state and beyond to the metro housing pool. This even before we have self-driving cars that would make multi-hour commutes more tolerable. Some of the new jobs in the metro are taken by existing residents growing into the job market so I question then “each new job means a new resident” statistic, and extreme teleworking makes the correlation even less. As rural farms consolidate I’ve seen them burn down redundant farmsteads, but now they can parcel off an acre or two and sell them to someone that works in the city.

    1. Ryan Ricard Post author

      It’s astute of you to point out that my big-picture view articulated here doesn’t really dictate where in the metro we ought to build new housing, though of course there are tradeoffs involved between added density in Minneapolis and St. Paul vs. expanding into further exurbs. We’d probably agree about minimum lot size and disagree about the MUSA, though I admit I don’t know much about that policy lever.

      You’re also more bullish than me about the post-pandemic future of remote work, but we’d sure have some fun debates to have if you’re right! So much of our urban design conversations are currently constrained by a hyper-focus on highway traffic patterns five days a week from 4-6PM. Think of all we could do if we weren’t yoked to the burden of the afternoon commute! Monte can draw up a plan to extend sewer lines past Wyoming, Ryan can call for a moratorium on new highway miles in the metro and and a ban on cars on both cities’ parkways, and we could have all sorts of wild debates here on Streets dot MN without having to design around “traffic and parking”

  7. Nathan Landau

    One commentor said that most recent housing had been built in large apartment buildings. That makes sense, because it’s true in other major cities. If that’s the case, it would seem that the Twin Cities need to change not only single family zoning, but also zone to facilitate more multi-family housing.

Comments are closed.