
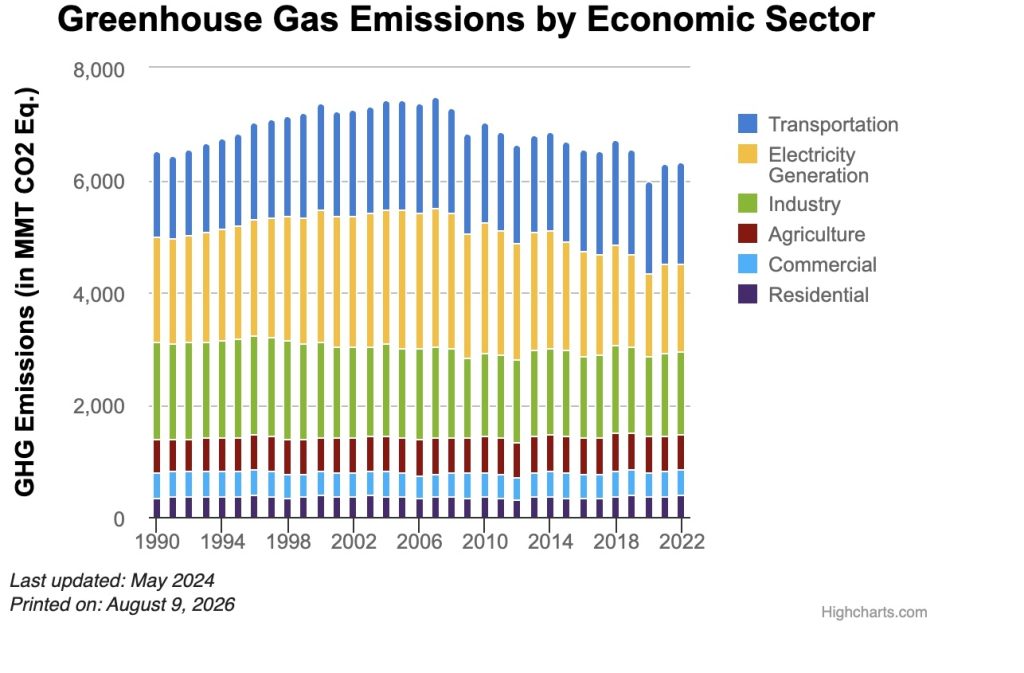
Transportation is the largest source of climate emissions, accounting for 28.5% of all U.S. greenhouse gas emissions in 2022. That is more than electricity or industry, according to the U.S. Environmental Protection Agency (EPA).
With transportation being such a significant source of climate emissions, many wonder how we can best reduce greenhouse gas emissions from hydrocarbons and curb climate change.
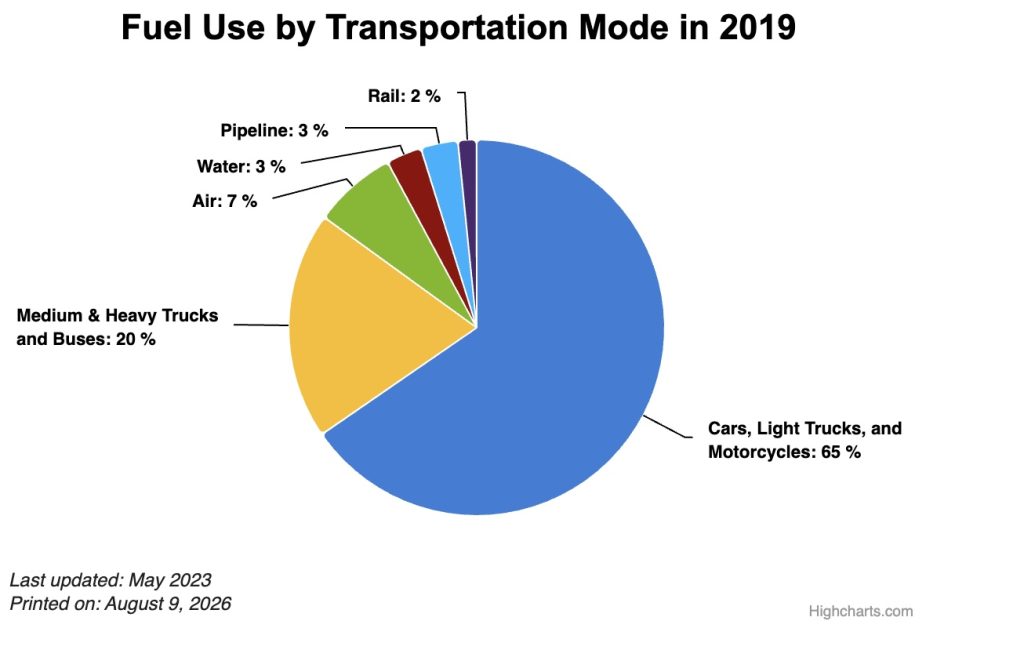
The vast majority of transportation emissions is generated by passenger vehicles like cars, light trucks, and motorcycles for everyday commuting and trips. By contrast, all air flights (both freight and passenger) is 7% and all rail is 2%.
The Minnesota Star Tribune analyzed trips from Minneapolis to Chicago by plane, train, and automobile in 2024. Their analysis was open-ended and shared data and perspectives on many factors like time taken, comfort, and of course environmental impact.
In 2026, the same factors influence the climate impact of different trips.
First, there is the distance traveled, which varies considerably depending on the route. Amtrak’s Borealis train winds its way through southern Minnesota and Wisconsin for 411 miles. By contrast, a one-way flight from Minneapolis-St. Paul to O’Hare in Chicago is about 366 miles.

The second factor is fuel economy. Driving an electric car like a Chevy Bolt has the lowest overall climate impact because the sum total of grid emissions and electric efficiencies produce far fewer greenhouse gas emissions than any travel method where the primary source of power is a petroleum-powered engine. The EPA estimates that for an average U.S. electric mix, the Chevy Bolt has a fuel economy of 109 mpg equivalent (mpge). By contrast, the Ford F-150 — the most popular passenger vehicle in America — runs at 25 mpg on the highway.
The final factor for our analysis is the number of passengers on a train or flight. This is harder to know because Amtrak does not share an average number. Looking at the Lake Shore Limited route that runs from Chicago to Boston, the average trip was 388 miles of a 1,017-mile route. These overlap, but even if a departure time is “sold out,” it may be only sold out in the sense of maximum capacity for one segment between two stations. By contrast, it is more rare for airline flights to have significant unfilled capacity with standby and non-revenue passengers able to fill the last remaining seats on flights.
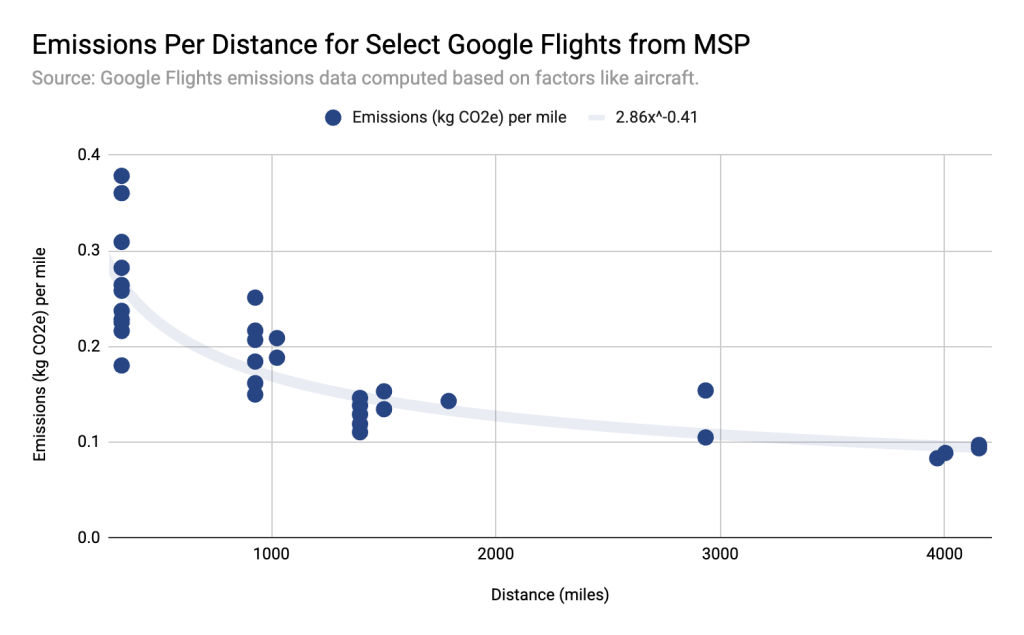
In late 2021, Google Flights added an estimated carbon emissions for flights listed on its booking portal. One criticism of the Google Flights estimate is that it does not include non-carbon impacts like water vapor and sulfur aerosols. Google Flights uses a proprietary Travel Impact Model that weights fuel burn, passenger load, cargo mass, passenger seat configuration, seat area, and flight distance for specific aircraft and routes. These estimates show there are a wide range of emissions levels for shorter routes. This is because there are a mix of smaller aircraft that are less efficient and larger aircraft that are more efficient. However, on the longer routes, like Minneapolis to Amsterdam, the combination of much larger aircraft and newer engines reduces emissions to below those of diesel-electric trains.
The tables below combine different data to paint a broad paintbrush picture. Any of the three factors can be different from train to train or flight to flight, especially with different aircraft and fuel types. The goal of this analysis is to give an overall sense of the impact, combining with other climate impact calculators so you can help decide what is in your budget for travel and also reducing emissions. But remember that no individual actions have the force of system change when done alone, so never feel guilty about skipping the seven-hour road trip.
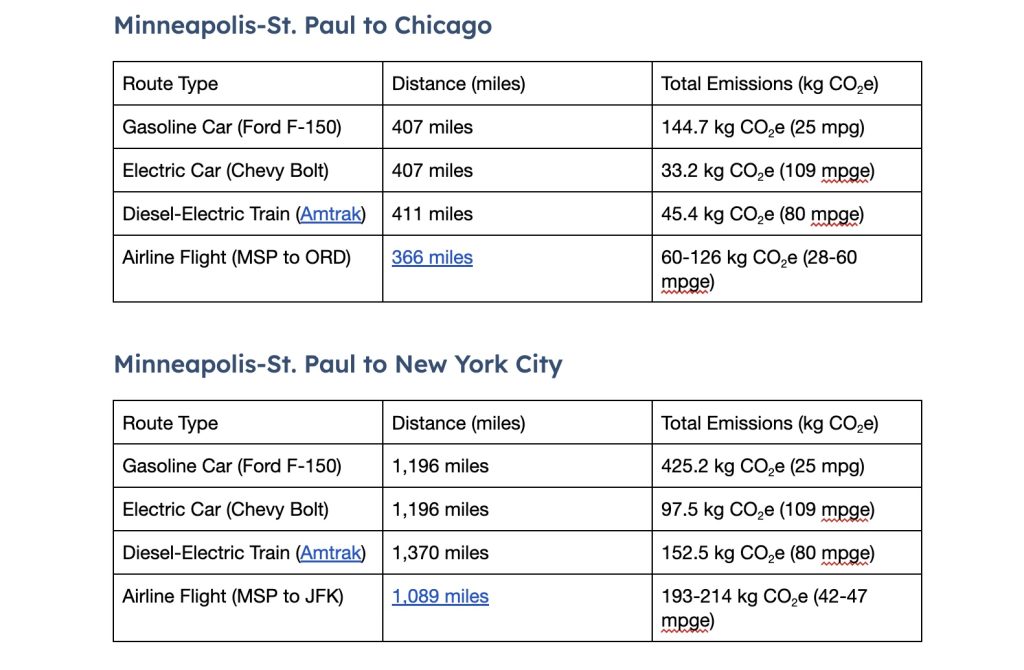
For the longest flight in this analysis, Minneapolis to Amsterdam was estimated by Google to be anywhere from 389 to 403 kg CO2e. This would potentially be equivalent to a gasoline passenger car with 94 mpge, higher than Amtrak’s 80 mpge. Non-carbon factors like time, food, and waste can also be considered when comparing an over 30-hour, two-train Amtrak trip from Minneapolis to New York City compared to a three-hour direct flight to JFK.
No matter where your travels may take you, it’s helpful to keep climate impact in mind. But travel for leisure is only a small portion of annual climate emissions. Daily decisions like how to make everyday trips and switching out inefficient appliances make a far greater impact. These daily decisions can also save you real money to save up to your next vacation. Safe travels, and I hope to see you cycling in Copenhagen soon!