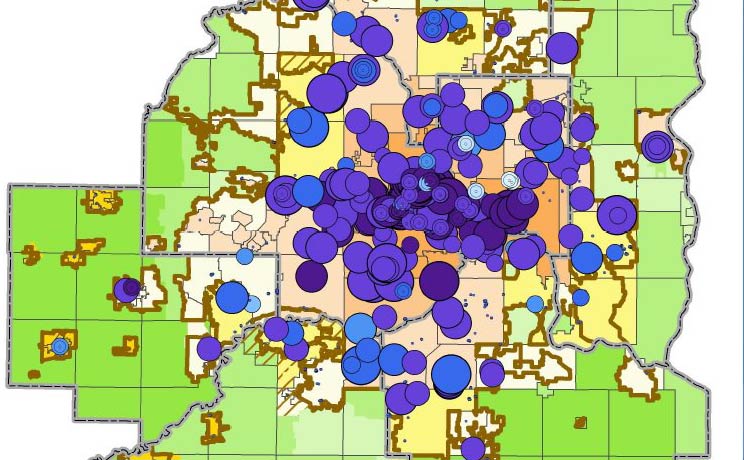
One of streets.mn’s loyal readers pointed me toward this great map from a recent report at last week’s Met Council meeting. Here’s the map:
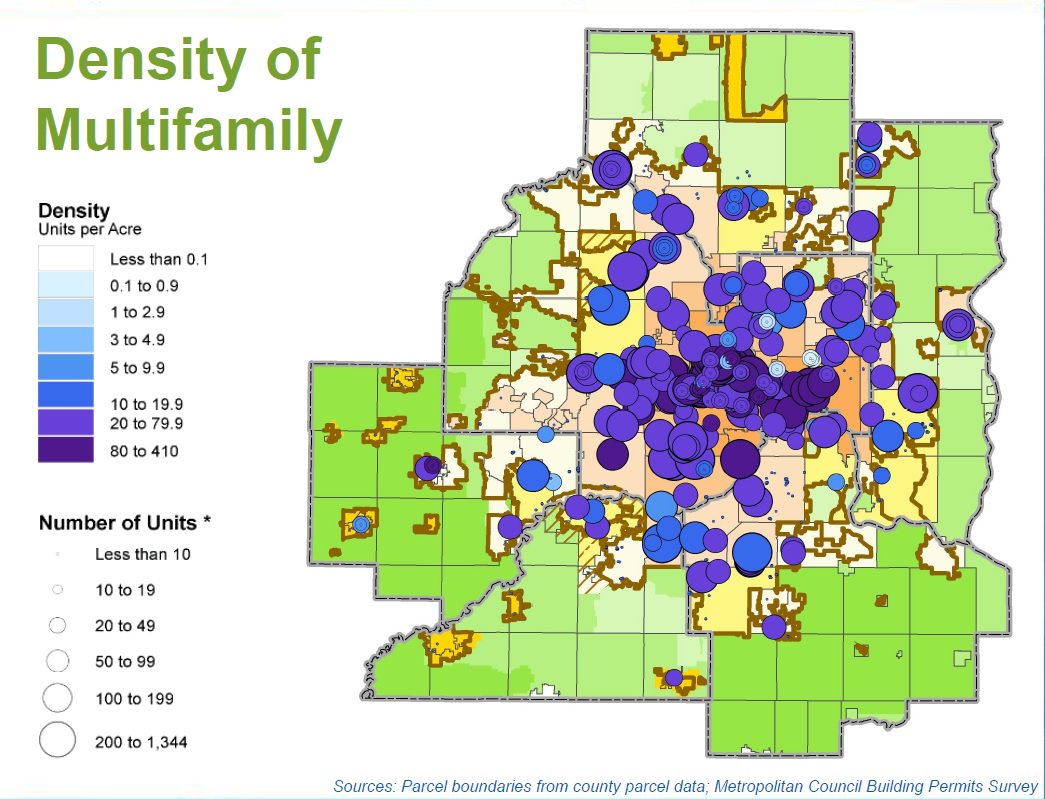
Inside the metro urban service area, multifamily density averages 35 units per acre, whereas all housing (all types) averages 6 units per acre. It’s also interesting to see how many multifamily units are built in the suburbs, in general.
I think this reinforces how important the Met Council has been in regulating and setting the tone for land use planning and development patterns in Minnesota, especially around housing.