
My guilty pleasure is the fitness app Strava. It functions to log your trips (or workouts) whether by bike, foot, or even canoe, and records your route, speed and other stats that can be gathered from various devices you can connect to the app. Once a year, I’ll be offered a free one-month trial, which I delay using. The premium version, the one people pay for, has a bunch of features that I’m not paid to promote, so I won’t.
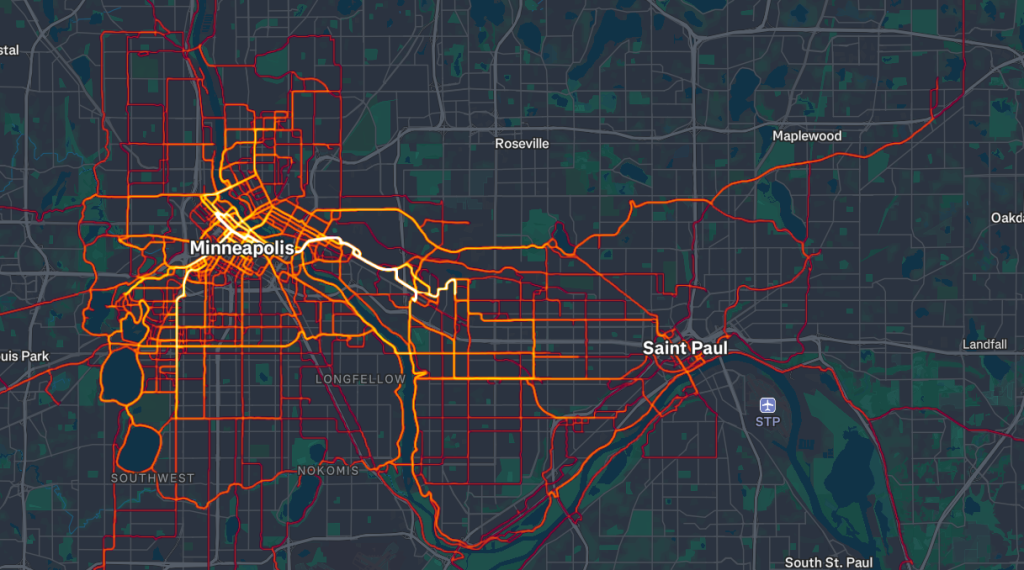
But the feature I love, and the feature for which I use a free trial (heck, maybe someday I’ll pay for it), is the personal heatmap. This map essentially shows all my logged activities at once. The thicker and brighter the line, the more I’ve traveled that route. Here, take a look at mine for the year 2024:
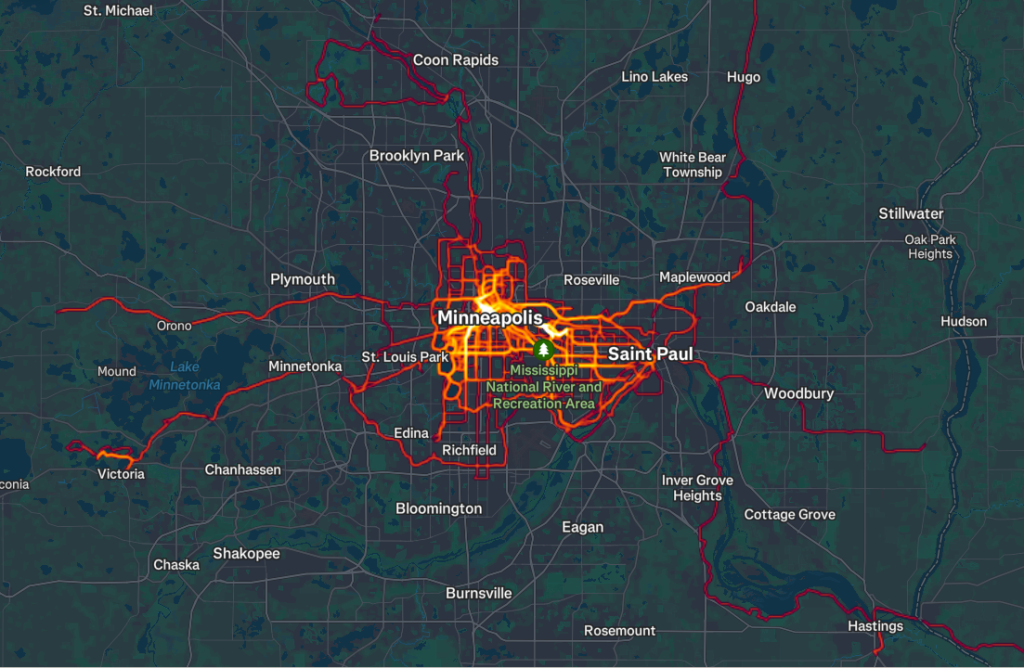
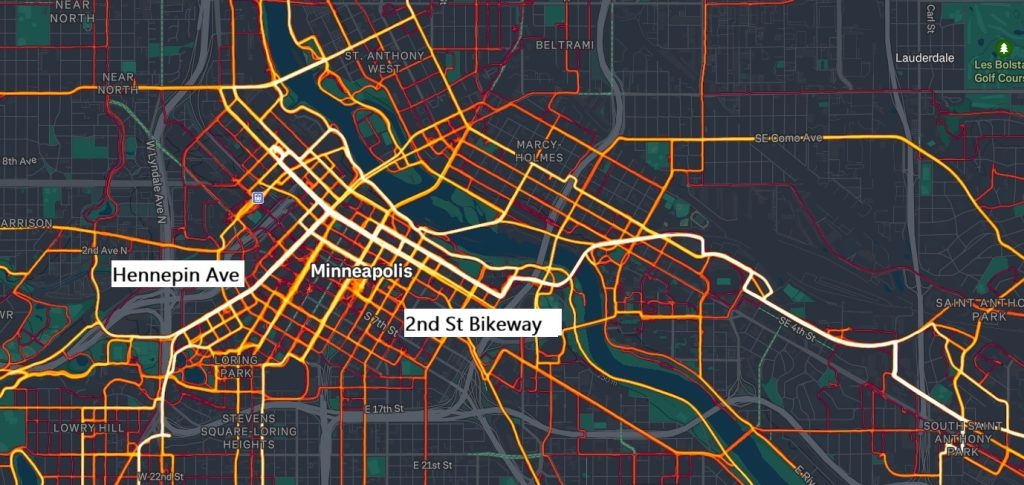
I love seeing my behavior mapped like this. I’m happy to share it, because it shows where big, impersonal infrastructure becomes personal. I won’t tell you all the reasons why I ride the relatively new Second Street bikeway in the Mill District so often — besides it being on my commute — but I’ll tell you that it’s my favored east/west route across Downtown Minneapolis because it’s protected infrastructure that connects to other routes, and that shows.
I live in Minneapolis, which this map makes pretty clear:
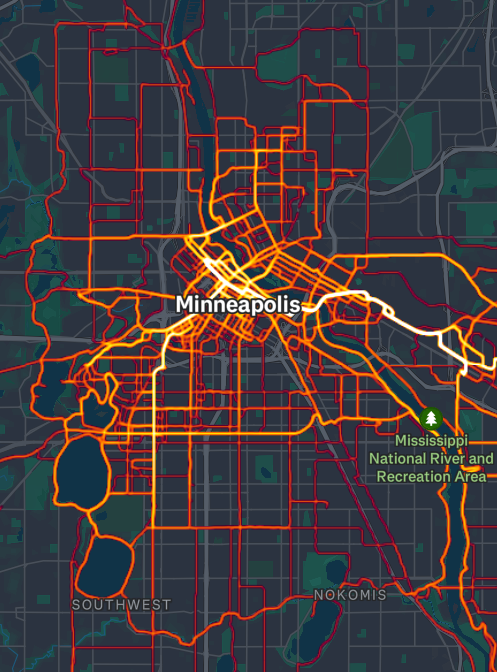
This map shows you that I live downtown, frequently return to my old haunts and friends in South Minneapolis, and have family and friend in Northeast Minneapolis. It also shows that I work in St. Paul, thus the blazing trail of light along the Dinkytown Greenway.
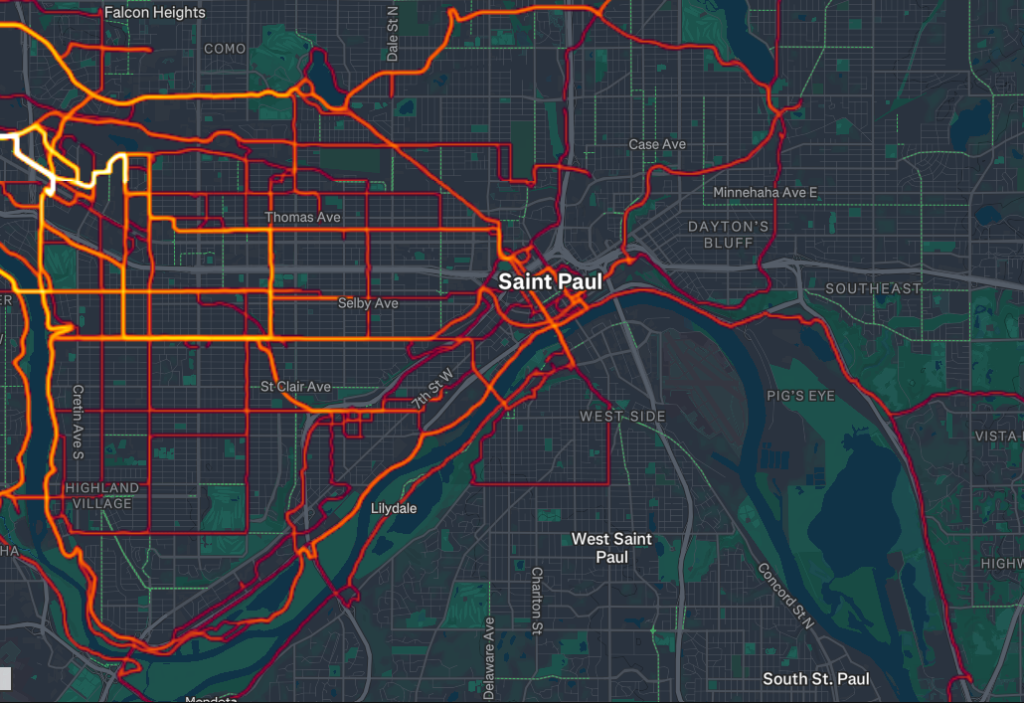
One of my major areas of work is within the borders of St. Paul, which makes this map interesting for me. I have the immense privilege of working for Move Minnesota, which understands and encourages me, when practical, to skip paying for parking and bike, bus or walk to off-site meetings and site visits, such as those I do for the Bike Rack Cost Share Program. This map also depicts some of the long rides I did this year: multi day trips to both Duluth and Milwaukee, Wisconsin. My weekly trivia night (more importantly, the trivia team) is also featured the map. I won’t say where, but it’s an open secret.
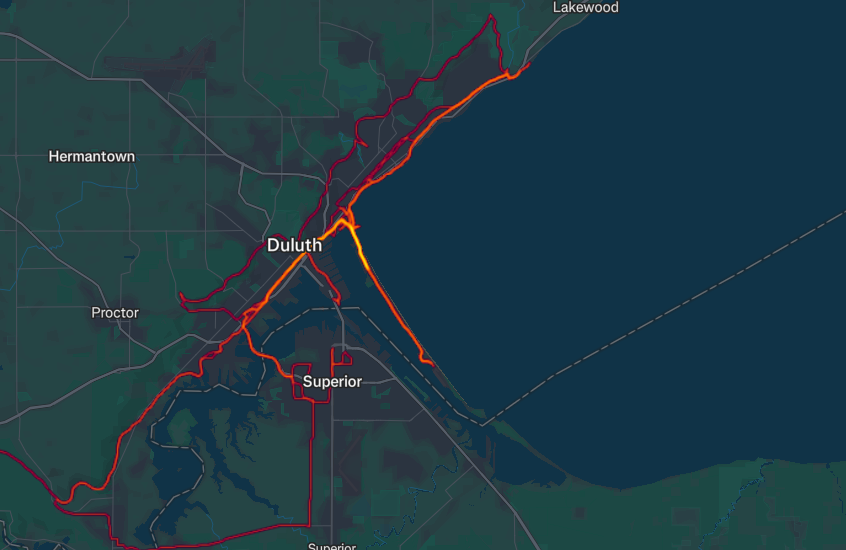
I also appreciate this map because it shows personal growth and boundary pushing. A great example of that is Duluth and Superior — the Twin Ports — which featured in my most recent post on Streets.mn. I’ll concede, I have not always been the most adventurous Twin Ports cyclist. I’ve long been content to stick to the lakewalk and riverbanks and never biked into Superior, Wisconsin, until this year. While there’s a lot more Twin Ports cycling I want (and ought!) to do, this map reflects a growing familiarity, a pushing of my own horizons.
I also get a chance to contextualize how contemporary advocacy reflects my lived reality. Hennepin County plans to rebuild Lyndale Avenue in 2027. A grassroots group of advocates, organizing with Move Minnesota, has created the Livable Lyndale campaign, which many authors in Streets.mn have covered well. Full disclosure: Livable Lyndale is a campaign with Move Minnesota, my employer. Streets.mn volunteers and board members are also involved in Livable Lyndale. I write this post and support the campaign as a private citizen, as well as a volunteer appointee to the Minneapolis Bicycle Advisory Committee, which has passed a resolution in support of Livable Lyndale’s goals.
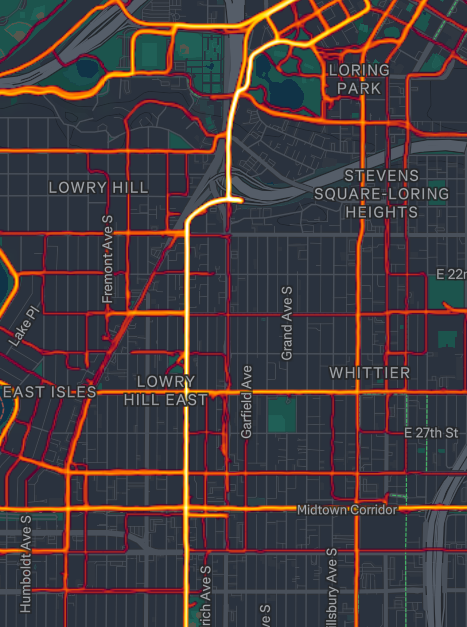
I no longer live near Lyndale, though not long ago I lived on the 2300 block of Garfield Avenue. I frequent Lyndale to meet friends, shop and support local businesses. This map highlights just how challenging navigating the area can be — whether it’s finding a way to cross over to Lyndale or using parallel routes where my bicycle is merely tolerated, if not outright resented or threatened. May the map show: We are due for a Livable Lyndale, and I no longer live in the 55408 ZIP Code.
And the Bad
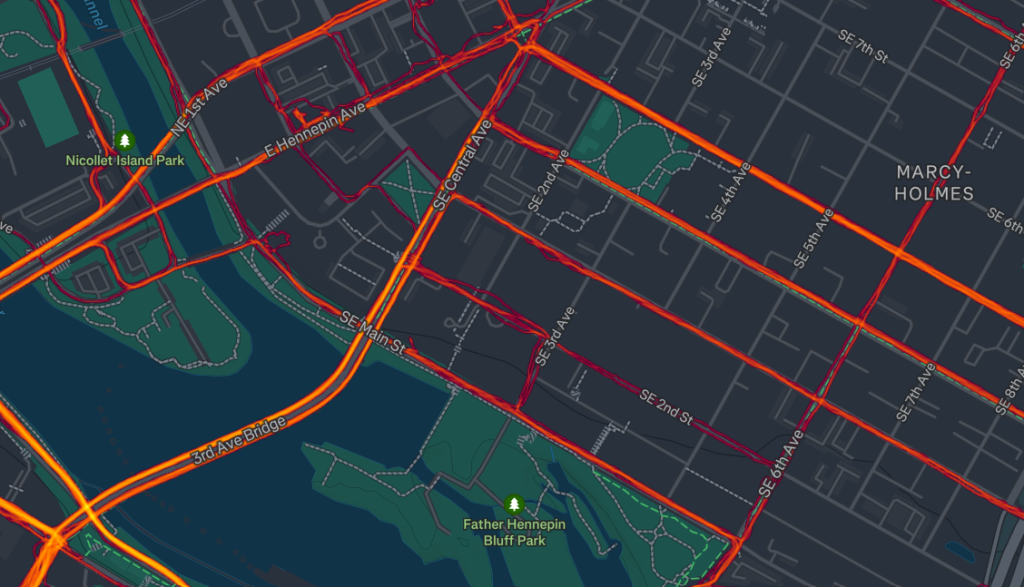
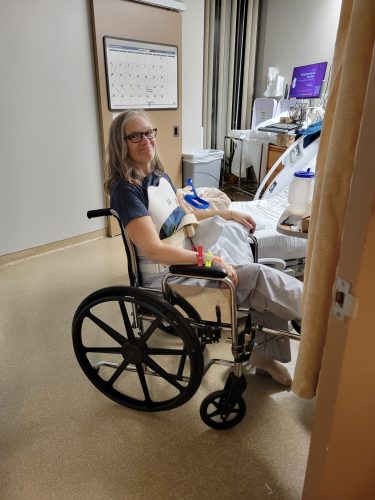
Of course, not every map shows fun things or slick points. This one shows the intersection where my mother, Julia Klatt Singer, was hit by a driver, walking across the street at a crosswalk the afternoon of Sunday, November 10, while she had the right of way. It was covered by local news media. I believe my mother has spoken on it best, in the television news interviews she has given. At press time, she’s recovering in her home in northeast Minneapolis, using a wheelchair (prodigiously!) while she recovers from seven breaks and fractures that span from her shoulder to her heel. I am grateful she’s alive and has escaped brain injury, spinal cord injury and organ damage. This map shows that this year I’ve passed the intersection where she was hit, Central Avenue and Second Street Southeast, relatively frequently.
I wonder whether my mother might not have been hit if the street were designed differently — if there were leading pedestrian intervals or tighter turns. I wonder if the upcoming project by the Minnesota Department of Transportation (MnDOT) to overhaul Central Avenue (their Highway 65) will make this street any safer for pedestrians. I also have to wonder if what witnesses at the scene said is true, which is that the driver stopped, and said he didn’t see her, and that they heard him confess that he was on his phone as he accelerated on a left turn when the light turned green and seemingly didn’t look up once. Shortly after this alleged confession, he fled the scene before authorities arrived, and remains unknown and at large. While I still believe full-heartedly in the power of design to make safer streets and better outcomes, I am realistic. Civil engineering, regardless of how well it’s done, does not come between a driver and their phone, their irresponsible drinking or their drug addiction. Maybe a shorter crossing would demand more attention from a driver scrolling TikTok. But maybe, even with a shorter crossing, with bump outs, with lighting, the phone would demand more.
The map contains the good, the bad, the banal commute. It contains safe infrastructure, unsafe infrastructure and midnight shortcuts I wouldn’t ride at a busier time of day. The map seemingly shows all (as I bike almost everywhere during the warm months, and a select set of destinations during the cold). But there’s also a bit of inscrutability to it. This map shows first dates, (as it happens) last dates, rushed errands and organized group rides. It shows joyrides and meetings with state agencies. It shows that I’m the kind of Streets.mn writer who will ride out to a newly installed safe infrastructure to see how it feels. (Or the kind who will go multiple times waiting for it to open.) Sometimes I’ll leave home without a destination in mind, or the destination in mind may be hundreds of miles away.
It is fair game to have mixed (or negative) feelings about our all-seeing, or panoptic, digital society. However, beyond those fears of digital surveillance, we ought to recognize that there’s not some idyllic past. For the average person, past times weren’t necessarily more private than contemporary society. You can’t necessarily do as you will around town if you live in a community where everyone knows who you are, or can guess from socially enforced markers (gender, food, clothing, profession and the like). I don’t think people need to follow me in my embrace of San Francisco-based fitness trackers. The excuse I make to myself is that if you do something often enough, it won’t matter how digitally invisible you are — reality is real, and therefore trackable. That’s eyes on the street, and the sidewalk ballet, isn’t it? Chances are, something is already tracking you (cough-phone-cough), whether it’s for better allocation of public resources, complex measures to capture your dollar or low-intensity state surveillance. (Or heck, even the new Google-based banner ads on Streets.mn.)
I like my personal heatmap, because I like maps. As a matter of fact, when I was an impressionable (and inexperienced) college youth, I made the decision to get half-majors in both anthropology and geography. Let me tell you, as an American, you pretty much only get a geography major if you like maps, or really like maps.
I like maps, and I like writing. That’s why I like writing for streets.mn. (Side note: Contribute to Streets.mn! Your perspective matters. You can contribute however you communicate and create, whether through words, photos or video.) There’s an observation from long ago I half recall among writers, especially new writers, especially fiction writers. It’s that they often write characters who are writerly themselves — characters who are content to observe the action, to comment on it, but less comfortable to participate in the action. Regardless of skill, talent or composition, observers don’t often captivate the audience for those writers — namely, readers.
Geography, from my bachelor’s degree understanding, has a similar problem. Maps are observer-ly documents. It’s a truism that mapmakers have no say on where mountains, or population centers are, or in the distribution of lead pipes or asthma rates. On the flip side, geography and mapmaking have been and will continue to be deeply related with power, whether wielded by the state, corporations or those who support and oppose the myriad causes to contest. Just look at where North America lands on the globe, and who lives there.
We are not just observers. I truly believe that mapmaking and writing have never been as democratic as they are now (roughly). It’s been less than a lifetime since the passage of the Civil Rights Act ensured that equality under the law was implemented and enforced. Since 1964, we have seen important additions to the legal interpretation and practice of democratic rights, such as those established in Miranda vs. Arizona. This is not to say that backsliding is unthinkable, that there have not been setbacks, that our rights are secure or fully established, that democratic citizenship is easily practicable for all. But if a time traveler had to pick a moment to stand for the security and expansion of democratic rights, I’d say there’s no time like the present.
There are many reasons nowadays to feel powerless. Some recent developments may heighten the reasons and ways. But you, reader, have power. There’s explicit ways to exercise it. However, there’s also many subtle ways, which I think frequently go underappreciated.
Making the map does not have to be as literal as I take it, which is by logging almost all my bike riding on a “free to use” for-profit fitness app that maps my location data. You make the map by doing exactly as you do:
- You make the map by riding transit.
- You make the map by riding your bike.
- You make the map by walking.
- You make the map by being a responsible driver, knowing the ins and outs of a legal crosswalk, where to yield and how to pass.
- You make the map by supporting local businesses, so they stay on the map. (You can make the map by starting a local business- because nothing lasts forever, and every generation should exercise their right to blaze their own path).
- You make it by supporting your neighborhood — not just through words, but in everyday, material ways: shoveling, block parties, sharing.
- You make the map as a voter — not just on maps that color entire states in primary-color swatches but as a voter who can vote in state, county, local, sub-local, union and neighborhood organization elections.
You make the map by commenting thoughtfully and truthfully on the maps of institutions or others — whether it’s as a Streets.mn post, an interactive story map, or a Google or Apple maps review. And to be perfectly transparent, even if all you do is read the Streets.mn blog posts, the Streets.mn WordPress site does capture your ISP address, so we know which country you’re reading from.
The map can be yours, whether it’s through literal maps or your choice to map your experience to others through the written word, pictures, podcast, video, other media or the sharing of a story with a stranger, friend or acquaintance. We need your maps and stories. Now is the time to share stories that cut against the grain or subvert it. It’s time for stories that inspire or surface uncomfortable tensions or repressed narratives. It takes effort, and vulnerability, but, as I’ve tried to illustrate, stories can be powerful — whether you are the sole audience, share them with friends, or offer them to anyone with an internet connection and a taste for local land use and transportation issues.
If you want to try that, Streets.mn is a place to do that. Just reach out to Managing Editor Amy Gage. You will make the map.
Travel safe, Happy New Year, and I hope we get to hear from you soon.