Editor’s Note: While Streets.mn editorial staff has reviewed this article for clarity and adherence to our submission guidelines; the data interpretations, specific “diagnoses,” and conclusions presented herein are those of the individual contributor. They do not necessarily reflect the official positions or endorsements of Streets.mn as an organization. Our goal is to provide a platform for community-led analysis of the Rethinking I-94 project to foster informed public dialogue.
The Minnesota Department of Transportation (MnDOT) is proposing to dismiss the At-Grade alternatives from the Rethinking I-94 Project for two main reasons: Safety and Mobility for people in motorized vehicles. This determination was made in the Rethinking I-94 Draft Scoping Decision Document (SDD), which is currently open for public comment until March 23. If you are unfamiliar with the SDD and Tier 1 EIS process, take a look at Part 1 of this series.
In Part 2, I covered how the conclusions of the safety evaluation are implausible, based on the uncertainty of small predicted differences between alternatives. The mobility analysis has stronger technical foundations, but there are some egregious omissions of important context. In Part 4, publishing soon, I’ll consider the philosophical implications of planning by traffic model.
The SDD evaluation found through travel demand forecast modeling that surface streets have less capacity to move vehicles than freeways, causing the At-Grade option to fail to meet Purpose and Need for Mobility. The mobility criterion was made up of ten metrics related to road capacity, speed, and travel time reliability. The latter two categories depend heavily on understanding how drivers would choose amongst many available routes to avoid congested roads, because the model simulates individual traveler behavior.
Detailed metrics on traffic congestion and diversion to alternate routes are a weak point of the traffic forecasts used for Rethinking I-94, according to comments on earlier drafts of the scoping materials made by the Metropolitan Council in 2024. The Rethinking I-94 team may have internally done work to address these comments, but I could not find any record of this in the publicly released Draft SDD. Key information on the uncertainty of forecasts is missing, as I covered in Part 2. The methods used to calculate some of the mobility metrics are also unexplained.
One of these metrics is the travel time index, a measure of how variable traffic conditions are throughout the year. Through following clues in a summary of Rethinking I-94 Traffic Working Group meetings, I found that the likely method assumes that travel time index will improve when the number of road lanes increases. The method is not designed to apply to some of the road configurations in the Rethinking I-94 alternatives, and there is no documentation of whether a different method was used for these alternatives.
So At-Grade would have been worse for drivers?
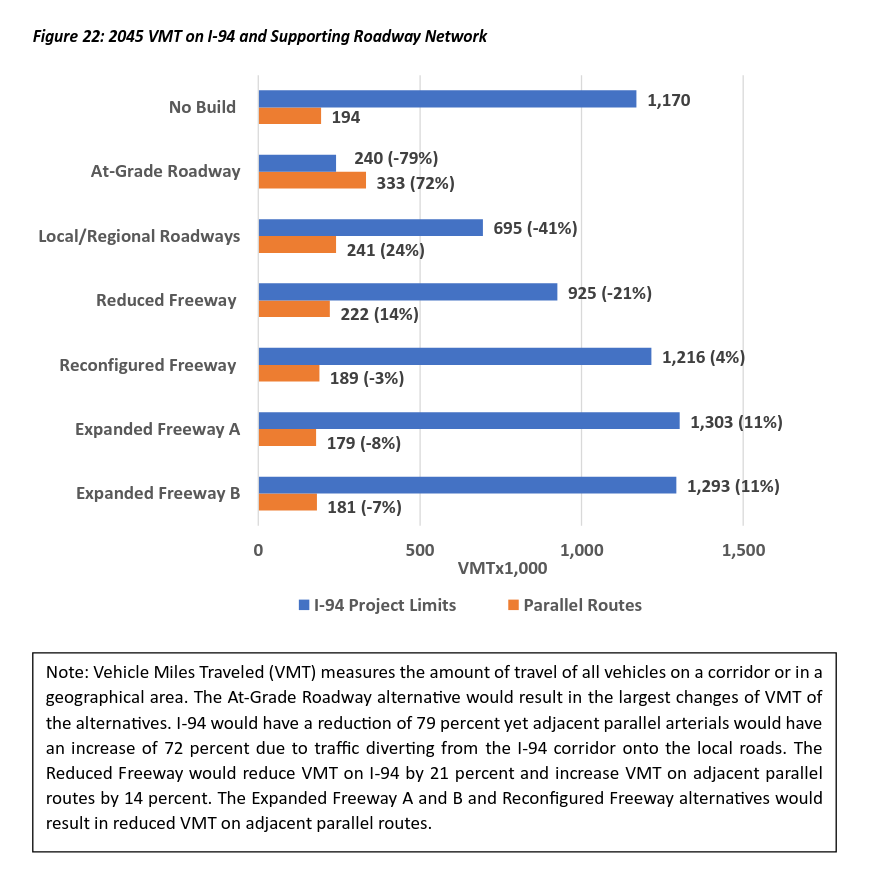
Vehicle Miles Traveled (VMT) predicted for I-94 and parallel routes. MnDOT predicted no substantial change on north-south routes with any alternative. Reproduced from Traffic and Transit Analysis.
The At-Grade road would have at most about one-fourth the capacity of the No Build option, and this will realistically be lower when considering signalized intersections, according to the Traffic and Transit Memo. MnDOT’s modeling found that even when taking into account diversion to alternate routes, just under half of east-west traffic could “evaporate.”
Because of the reduced speed limit of an at-grade road, end-to-end trip times would increase, according to the Traffic and Transit Analysis. For a No Build scenario, MnDOT predicted this metric as 8 to 11 minutes depending on time of day, which could increase to 18 to 23 minutes with an At-Grade conversion. Considering that most trips on I-94 are on the freeway for a short distance, it’s possible that the effect on real-world trip times would be less than this implies. However, longer trips would be impacted.
The conclusions on capacity and the free flow travel time have hard limits based on the geometric design and posted speed limit of the road, whereas the prediction of how much traffic would evaporate and how fast rush hour traffic would travel are influenced by the complexities of predicting which routes drivers would take.
There are two groups of people who the possible changes would impact: the people who would still choose to drive, and those whose trips would evaporate. First, let’s think about the drivers, as they are the main focus of the mobility evaluation. I’ll come back to the evaporated trips in Part 4.
Where will all the cars go? Hard to know
Making conclusions about anything that has to do with the distribution of traffic onto different roads and the actual speeds traffic will travel runs into some limitations of the model which I covered in Part 2. It’s possible to speculate that a large reduction in trips could happen because some people would switch to other modes, some would choose to chain trips together more efficiently, some would move to a new home or workplace, and some would just avoid traveling. At this stage, the modeling does not tell us about exactly what would happen.
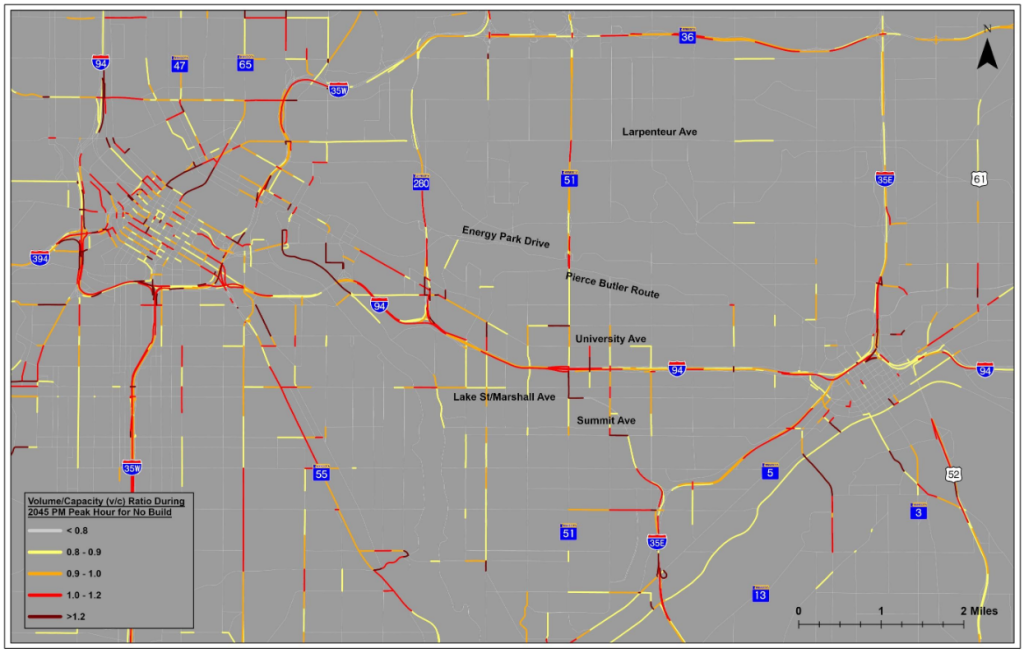
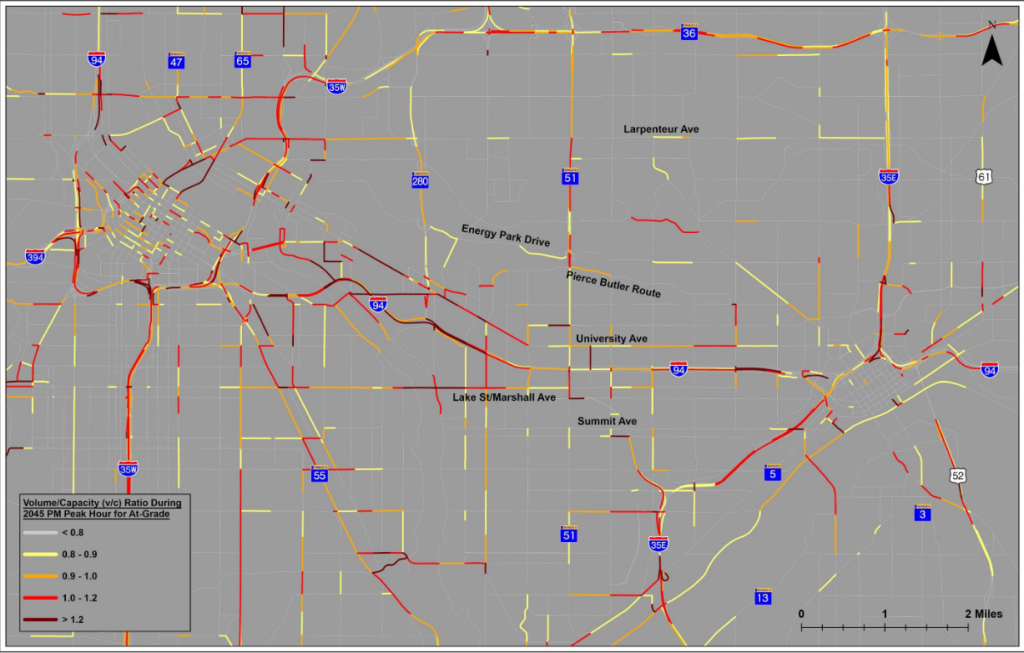
The SDD Scoping Alternatives Evaluation generally recognized that the At-Grade alternatives would not be expected to have the same speeds as freeway alternatives, but concluded that measures of congestion were also worse in the At-Grade scenario. The various estimates and maps produced as part of the Draft SDD Mobility evaluation suggest that congestion on streets around the area would be a lot worse in the At-Grade scenario than the other alternatives. Relevant information is split between Evaluation Matrices and the Traffic and Transit Analysis.
One of the main measures of systemwide congestion in the Traffic and Transit Analysis is the ratio of volume over capacity. Volume is the number of cars, and capacity is the space on the road. The traffic model is able to assign more cars to a road link than would physically fit there, which would indicate that there is more demand than supply and the road would become congested, but according to a report prepared for the planning agency in Washington, D.C., it’s also a limitation of travel demand models–we can’t easily find out where those drivers will actually go because all the model says is that they won’t fit on the road. In the At-Grade scenario, the Traffic and Transit Analysis predicts that a higher proportion of road links will have a volume to capacity ratio over one in the At-Grade scenario than for other alternatives.
VV
Based on the magnitude of predicted differences, making a conclusion on congestion is more plausible than the conclusions based on razor-thin differences between alternatives in the safety study, but the appropriate level of uncertainty is still likely high.
According to a comment from the Metropolitan Council in the Our Streets FOIA request from 2024, “the precise magnitude of diversion on any particular road is hard to measure with static assignment models.” The same reviewer suggested in another comment “that some level of sensitivity analysis of the local traffic impacts to different levels of traffic diversion and/or travel demand reduction be completed.” The reviewer concluded that “in the absence of these sensitivity tests or calculating diversion with a meso-scopic traffic assignment tool, the results currently lack sufficient confidence in specific traffic diversion forecasts to be used for decision-making at this stage.”
MnDOT responded that “follow up discussions will take place regarding traffic modeling and sensitivity testing.”
Traffic Working Group meeting summaries reveal that in 2024, WSG, a consulting firm, did some kind of traffic sensitivity analysis with the goal of “understand[ing] if the model is redistributing too much traffic and address[ing] questions about ‘traffic evaporation.’” WSG showed the working group a map, which “was helpful and will be included in the memo–” which I assume refers to the Traffic and Transit Alternatives Analysis Memo.
However, the map is not included in the version of the memo released with the Draft SDD. It’s unclear from the meeting summary if the map was the only product of the sensitivity testing. If WSG did provide the ranges for various numerical metrics based on sensitivity testing, it’s not clear why those are not included in the SDD. Ricardo Lopez, a MnDOT spokesperson who I corresponded with on other issues, was not available to give a response on this topic in time for publication.
Traffic Evaporation
The evaporation of nearly half of east-west traffic is a major change unique to the At-Grade modeling so it makes sense that the Traffic Working Group had questions.
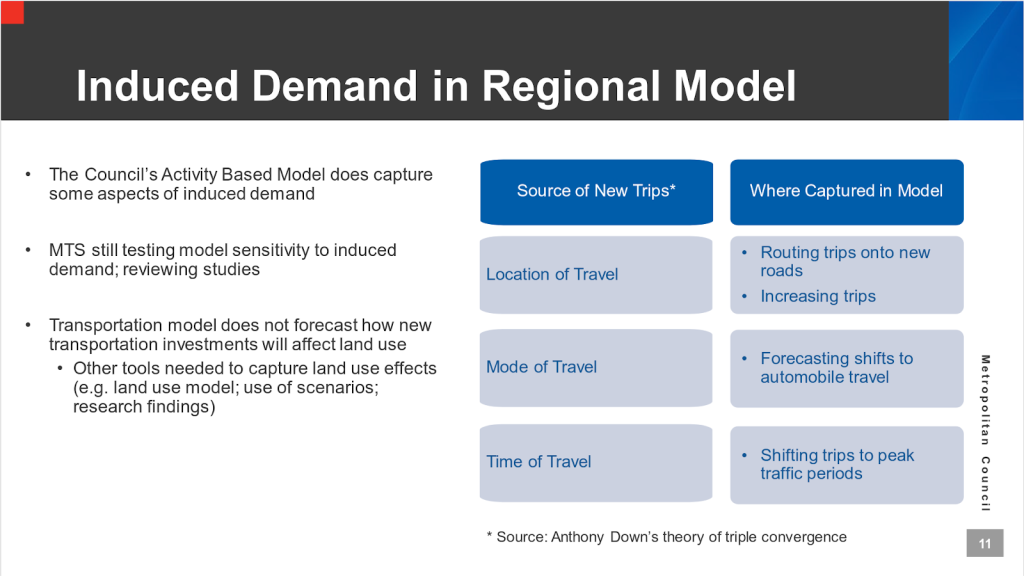
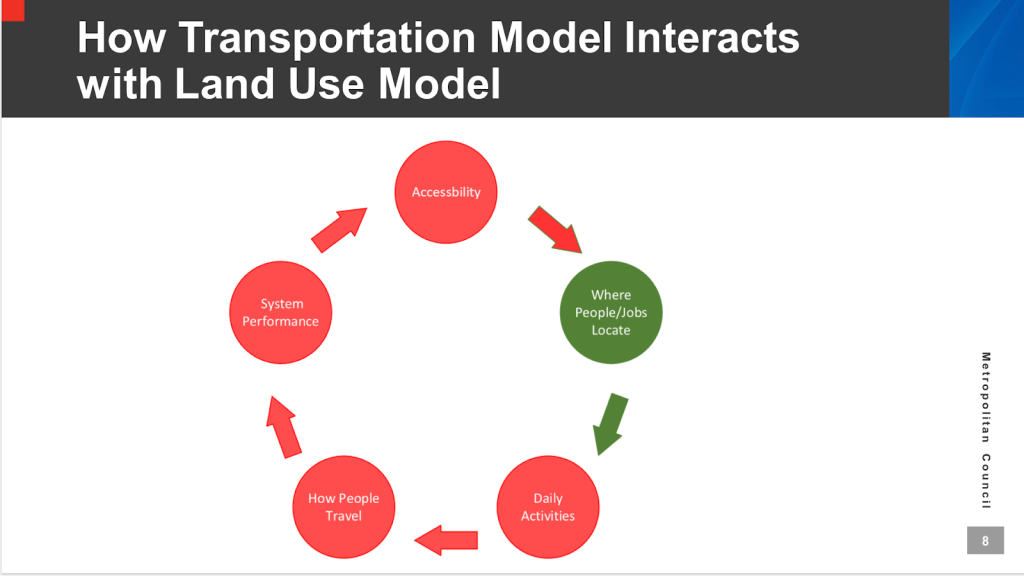
Traffic evaporation is a reaction to reduced roadway capacity in which drivers on aggregate choose to drive less. This is the opposite of induced demand, something which is generally not well understood in travel demand models. According to a slide deck, the Metropolitan Council was working on testing how the regional travel demand forecasting model represented induced demand in 2023, while work on Rethinking I-94 had already started.
Since I could find no publicly available documentation of what WSG actually did in the sensitivity analysis, it’s impossible to evaluate the conclusions in the Draft SDD.
Land use matters for traffic
Another known source of uncertainty in the forecasts is that MnDOT doesn’t know where people will want to travel to or from in an At-Grade scenario. The regional travel demand model, the source of the traffic predictions, relies on a land use forecast, which it uses to simulate individual peoples’ choices to visit various destinations throughout the day. The At-Grade scenario would result in around 85 acres of land becoming available for homes, businesses, services, and parks, according to analysis by Our Streets. This would potentially increase demand to travel on the I-94 corridor, but there are also ways it could decrease the time and distance people spend traveling. Throughout the Twin Cities, some trips would become shorter in distance, if people chose to switch to visiting redeveloped locations on the I-94 corridor. In the immediate vicinity, more locations would become accessible by walking to more people.
Lopez, the MnDOT spokesperson told me in an email that “Land use forecasts are inputs to the travel demand model and do not vary in response to changes in the transportation network. MnDOT does not make land use decisions, and the I-94 project is not developing future land use scenarios. The model is built upon the land uses determined by cities as part of their comprehensive plans.” In a separate interview, a Metropolitan Council staff member clarified that the Council does have a land use forecasting model which can take inputs from the transportation forecasts, but that this would not be used in a federal environmental impact study because the alternatives need to be evaluated with a consistent forecast based on the local comprehensive plans.
A reliability metric is similar between alternatives that advanced and At-Grade
Another measure of congestion is the travel time index (TTI), which “is the ratio of corridor travel time in the peak period to travel time at free-flow speeds or uncongested conditions,” according to the Scoping Alternatives Evaluation. When travel time is unreliable, drivers need to plan for the worst-case scenario, not the average one. This adds time and stress, even on days when traffic is flowing well. The method for calculating TTI is not explained in the Traffic and Transit Analysis Memo or elsewhere in the SDD.
| Alternative | Travel Time Index Mean | Travel Time Index 95th Percentile | Meets P&N For Mobility? |
|---|---|---|---|
| No Build | 2.0 | 3.6 | No |
| At-Grade | 2.5 | 4.3 | No |
| Maintenance B | 2.0 | 3.6 | Yes |
| Reduced Freeway General Purpose Lanes | 3.2 | 5.3 | Yes |
| Reduced Freeway Managed Lane | 2.5 | 4.4 | |
| Reconfigured Freeway General Purpose Lanes | 2.1 | 3.8 | Yes |
| Reconfigured Freeway Managed Lane | 2.1 | 3.7 |
In the Scoping Alternatives Evaluation narrative summary, reliability is listed as the first failed mobility sub-criterion for At-Grade: “mobility is negatively impacted on both a corridor and systemwide level through decreased travel time reliability, increased vehicle hours and person hours traveled, decreased person throughput, and decreased speeds.” The increased vehicle and person hours traveled are predicted increases of total time spent traveling by all people in the Twin Cities Metro of twelve percent and nine percent, respectively. Since this metric takes into account predicted vehicle speeds, I think it is likely that the associated uncertainty would be high.
For both Reduced Freeway and Reconfigured Freeway, the travel time reliability is not mentioned at all in the corresponding narrative summaries, despite Reduced Freeway’s being worse than At-Grade, even in the managed lane–and No Build beating all of them.
Because TTI is a ratio of the free flow travel time, a 95th percentile trip on At-Grade would still take longer than the same trip on Reduced Freeway, because the baseline speed limit for At-Grade is lower–assuming the TTI is accurate.
Where did these TTI numbers come from?
Metropolitan Council staff were wondering the same thing in 2024, according to a comment in the Our Streets FOIA requested documents. The commenter noted that “the methods for calculation of this measure and the results were not included in the Traffic and Transit Analysis memo, nor ever discussed by the Traffic Working Group. Council staff don’t have sufficient information to review and comment on this measure and its use, but the reported results seem very precise compared to other mobility measures.”
MnDOT replied that “More details on the methodology for each measure are included in the evaluation criteria memo, which has been distributed previously and will be included as an appendix to the alternatives evaluation memo. The footnotes for Table 3 also provide more details on the travel time index calculation used to measure travel time reliability.”
Here is the extent of the details that are included in the current Draft SDD:
- Under Table 3 (Evaluation Matrices appendix): “Calculated using weighted average peak hour volume to capacity ratio using regional model outputs.”
- In Evaluation Criteria: “The estimated change in travel time reliability for each alternative will be calculated using the HCM planning method and forecasted traffic volumes from the ABM [Activity-Based Model, the traffic forecasting model used for Rethinking I-94]. Travel time reliability will be reported separately for managed lanes and general purpose lanes where applicable. This methodology captures the congestion as well as the effects of weather, crashes and other incidents on the travel time on the facility.”
The Traffic and Transit Analysis has not been updated to include any additional information.
Okay, so where do the TTI numbers come from?
The TTI values for Rethinking I-94 were calculated substantially or completely by WSG, according to a summary of Rethinking I-94 Traffic Working Group meetings. Here, it is also explained that the calculation was done in a “simplified way following NCHRP guidance on planning applications of Highway Capacity Manual procedures.” NCHRP guidance likely refers to this document published by the National Cooperative Highway Research Program. In the Draft SDD, the Highway Capacity Manual is only ever referred to by its initials, HCM, and the NCHRP modification is not mentioned.
Certain chapters of the HCM are available to the public online. One of these is an older edition of the travel time reliability chapter published in 2014, which should be close enough for the limited depth here. In newer editions, it’s been moved to a different chapter, which isn’t part of the online release.
The TTI was originally meant to be calculated by making estimates of travel times for multiple times of day, usually for all of the days of a year. These can be estimated from a single forecasted demand for travel by multiplying the initial forecast by a matrix of “demand pattern data” which explains how traffic volumes are expected to vary throughout the year. The mean and 95th percentile values represent an average day of the year, and the 18th most congested day of the year, respectively.
For freeways, the variance in traffic volumes accounts for weather, construction, special events, and crashes by either taking local data or defaulting to a predetermined value. A few values cannot be defaulted, including “probabilities of specific crash and incident types by location” or “alternatively, segment and intersection crash frequencies.” The method for urban streets includes additional required inputs to reflect the added complexity of urban street networks.
However, if the NCHRP guidance was followed, the “simplified way” removes nearly all of the input data, essentially defaulting the values that weren’t originally intended to be defaulted. If WSG followed this method, the TTI would have been calculated using only four pieces of input data for freeways:
- The free-flow speed in mph
- The peak hour speed in mph
- The number of lanes in one direction
- The peak hour volume to capacity ratio
Using this method, the mean TTI value is derived through basic arithmetic operations. When the input number of lanes increases, estimated mean TTI will decrease.
The 95th percentile TTI estimate is the natural log of the mean TTI estimate times 3.67, plus one. This relationship appears to be true of the Rethinking I-94 TTI values, accounting for rounding error.
If the At-Grade boulevard was considered to be an urban street, there is no simplified reliability analysis method available in the NCHRP guidance. Because the 95th percentile and mean share the same relationship as the freeway values, it’s possible that WSG considered the At-Grade road as a freeway.
The HCM method was also not intended to be used with managed lanes as of 2014. It’s possible this was updated in later editions, but I did not find any NCHRP guidance on managed lanes either. Exactly what methodology was applied for these lanes is not something I have found in any documentation for Rethinking I-94.
The SDD includes a separate transit TTI sub-criterion for mobility, but this is just a repeat of the car traffic TTI for managed lanes. For alternatives which did not have a calculated managed lane TTI–At-Grade and the freeway options with shoulder express buses–the transit TTI is just the general travel lane TTI. A MnDOT response in the Our Streets FOIA seems to not actually understand this–MnDOT replied to a comment asking about transit TTI that, “while the At-Grade alternatives would provide a dedicated lane for buses, which may decrease travel times, the reliability/consistency of those travel times may still be impacted.” The dedicated lane is not actually accounted for in the TTI still being used for the current SDD draft.
I’m not sure why clear information on the methodology wouldn’t be included in the SDD. There are a number of choices that had to be made that would have affected the results, of which I could find no public record at all. Members of the public and agency staff who weren’t in Traffic Working Group meetings may have an interest in understanding what went into the SDD.
Keep your secrets, MnDOT
The Draft SDD includes no substantive explanation of much of WSG’s contribution to the project. We don’t know about TTI, but more importantly, we don’t know about the sensitivity analysis. We don’t know the extent of variation in inputs that was tested, we don’t know if there were instances of overlap between alternatives, and we don’t even know if the findings were ever presented numerically.
The necessary information to understand the range of possible traffic futures might exist–but MnDOT hasn’t released it to the public.
The core finding of the mobility analysis is that a surface street is different from a freeway. While the congestion and reliability metrics are missing the context needed to properly evaluate any differences, the At-Grade alternatives would have lower capacity, lower speeds, and lower vehicle throughput. That’s really the issue–MnDOT appears to have designed alternatives that would obviously not meet Purpose and Need for the project. Put another way, MnDOT designed Purpose and Need that would require a freeway. Come back for Part 4 for a philosophical consideration of the purposes and needs Rethinking I-94 could be addressing.