
Editor’s Note: While Streets.mn editorial staff has reviewed this article for clarity and adherence to our submission guidelines; the data interpretations, specific “diagnoses,” and conclusions presented herein are those of the individual contributor. They do not necessarily reflect the official positions or endorsements of Streets.mn as an organization. Our goal is to provide a platform for community-led analysis of the Rethinking I-94 project to foster informed public dialogue.
The Minnesota Department of Transportation (MnDOT) used traffic forecasts to claim that the At-Grade alternatives for Rethinking I-94 would be less safe than a freeway and dismiss them from the project, but the forecasts are unlikely to be accurate enough to differentiate amongst the tiny predicted differences between alternatives. This safety evaluation was made in the Rethinking I-94 Draft Scoping Decision Document (SDD), which is currently open for public comment until March 23. If you are unfamiliar with the SDD and Tier 1 EIS process, take a look at Part 1 of this series.
In the Draft SDD safety analysis, MnDOT used the Metropolitan Council’s regional travel demand model to predict traffic flows on I-94 and nearby roads in 2040, and then multiplied the predicted number of vehicle miles traveled on each road link by statewide severe crash rates for similar types of roads. Severe crashes are crashes which result in a death or serious injury. The SDD reasons that alternatives which reduce capacity on I-94 will cause drivers to choose alternate routes which have more conflicting traffic and obstacles than a freeway, leading to a higher number of severe crashes. This logic is theoretically sound, but the greatest predicted change in severe crashes was less than a 5% difference from the No Build baseline. In all alternatives, at least 85% of the predicted crashes occur on roads other than I-94.
The Draft SDD recommends dismissing alternatives which increase the predicted number of severe crashes compared to No Build. However, this is not a straightforward determination: according to the Rethinking I-94 Alternative Safety Analysis, the traffic model’s “accuracy in estimating link-level volumes is limited, particularly for lower-volume, lower-functional class roadways.” This characterization applies to many of the roads near I-94 in the Twin Cities. MnDOT attempted to account for this uncertainty by applying a window of ±2% in which differences would be considered “neutral or no change.” When asked about using this 2% window with road link forecasts, Metropolitan Council spokesperson Emma Sroda said that “the regional travel demand model is not designed to predict individual link flows with that level of accuracy. The model is calibrated and validated to reflect travel behavior for a base year at a regional scale.”
A spokesperson for MnDOT, Ricardo Lopez, disagreed, in an email exchange with a Streets.mn contributor, explaining that “The 2% threshold was selected in coordination with a traffic working group that included representatives from FHWA, Metropolitan Council, the cities, and counties. The analysis considers all roadway segments in the model within 1 mile of I-94, and model results aggregated over many segments are more accurate than results for any given segment.”
Based on historical data on traffic forecasting accuracy, 2% would still be well short of the expected model inaccuracy even after aggregating segments. A point forecast–a single predicted value–represents one possible outcome of the prediction model, based on one set of input data. Some of the input data is itself a forecast or estimate, and the output does not necessarily respond predictably when the inputs change. MnDOT’s advice from 2009 is to test the model’s sensitivity to varying inputs, and report a range of results based on the distribution of predictions. When point forecasts for different scenarios are similar, it’s possible that these ranges will overlap. If this kind of sensitivity testing was done for Rethinking I-94, the results were not included in the Draft SDD.
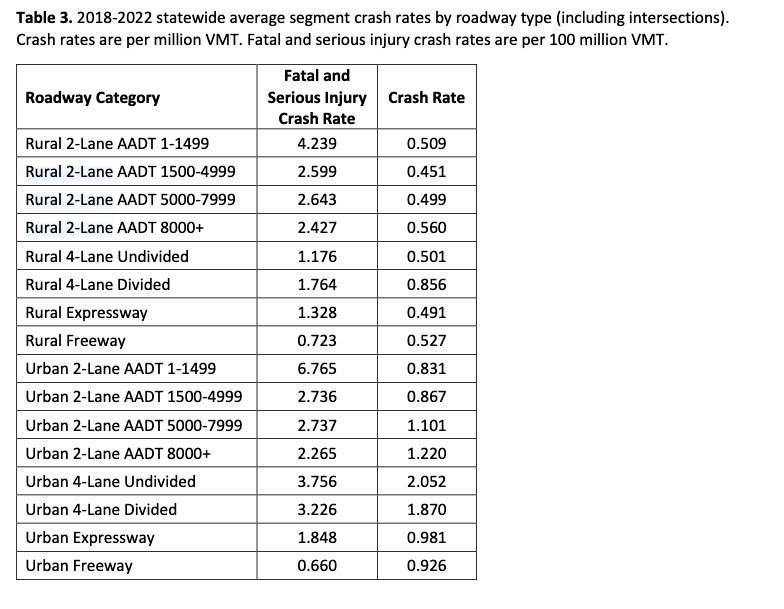
Using statewide crash rates introduces a second source of uncertainty which would make comparing between alternatives less accurate. These statewide crash rates don’t account for the full variety of road types in the project area–in a letter to MnDOT, senior staff at the Minneapolis departments of Public Works and Community Planning and Economic Development pointed out that the statewide rates do not even differentiate between freeways with different numbers of lanes. This is a clear case of precision without accuracy–because this method under-predicts the number of severe crashes compared to the historical average by about 60%.
Records obtained by a Freedom of Information Act (FOIA) request from Our Streets, who were not involved in producing this report, show that the 2% threshold was created in response to critical comments from other agencies. A 2024 draft of the SDD apparently had no uncertainty modifier for the safety analysis–a comment from the Metropolitan Council reads: “because the safety results are closely related to the issue of the level of traffic diversion and volume increases on parallel corridors, we recommend that the safety measures be considered with a similar level of uncertainty as the travel forecasts.” MnDOT responded that “the project team is in the process of refining the safety results using a threshold of +/-2% for consistency with the approach used in the traffic memo.”
The Preliminary Traffic and Transit Analysis of Alternatives Memo doesn’t use a ±2% threshold anymore. The version of the document released as part of the Draft SDD does not identify a consistent uncertainty threshold, but at one point refers to changes in forecasted traffic of about 20% on routes relevant to the safety analysis as “no substantial change.”
Understanding all of this as a reader is made more complicated because the predicted number of crashes and percent differences between alternatives don’t match across different Draft SDD appendices. While the Alternative Safety Analysis generates tables of point estimates, other documents within the Draft SDD refer to what appears to be a range of values without explanation. Since there is only one point estimate for each alternative, this means half of the numbers presented as the results of the safety analysis are either out of context or wrong.
Safety is one of two main reasons that MnDOT recommends dismissing the At-Grade alternatives from further study. The other is Mobility for people in motorized vehicles. Simply put, a surface road will not move as many people in vehicles as a freeway. My analysis of missing information about the Mobility analysis will be available in Part 3.
A dangerous place
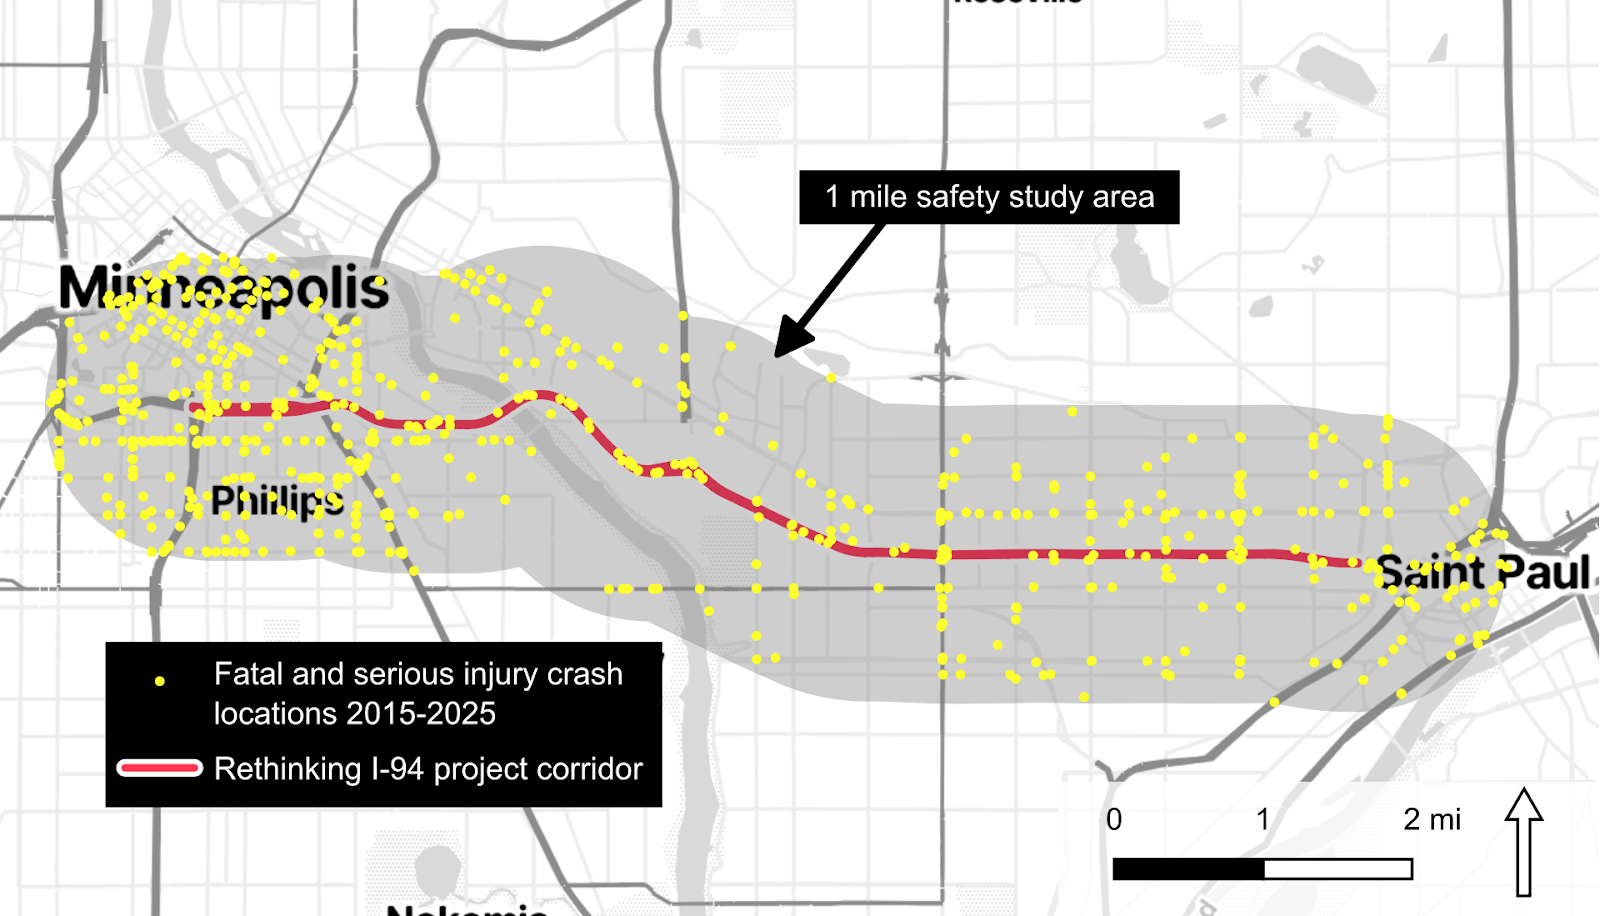
The I-94 corridor in the Twin Cities is already a dangerous place. For the Rethinking I-94 Safety Analysis, MnDOT defines a study area of the freeway corridor and routes within one mile between I-35W and Marion Street. In an average year between 2013 and 2023, there were 64.2 vehicle crashes which resulted in a fatality or serious injury within the study area.
The freeway form causes safety problems in addition to just vehicle crashes. Neighborhoods along the corridor have some of the worst air quality in the Twin Cities, with pollutant levels 2 to 3 times Minnesota Pollution Control Agency’s benchmark for health risks. Even shifting to electric vehicles won’t eliminate this problem. Because the freeway blocks most north-south roads in the study area, people who want to walk, bike, or roll have to take longer trips to where they are going, during which they will be exposed to more intersections, many with heavy traffic coming on and off ramps or funneled onto the limited number of through streets which cross the freeway–something that is noted in the Draft Purpose and Need Summary, updated in 2022. The Draft SDD contains evaluation criteria related to pollution and vulnerable road user safety, but did not differentiate between any alternatives outside the No Build/Maintenance family.
For readers looking for a summary level analysis, the main points have been covered. The remainder of this article explains the complete Safety evaluation process and provides an overview of how uncertainty in traffic forecasting has been studied.
Purpose and Need
Safety is one of four Purpose and Need (P&N) criteria for Rethinking I-94. In full, the P&N criteria are:
- —Improving comfort, mobility and risks for people walking, bicycling and rolling
- —Safety for people in motorized vehicles–cars, freight and transit
- —Addressing aging infrastructure
- —Mobility for people in motorized vehicles–cars, freight and transit
Part 1 of this series included some necessary context on the various SDD appendix documents, including abbreviated titles I use.
No Safe Alternative
The full statement of Purpose for Safety is to “enhance safety for people and goods on, along, and across the I-94 corridor for all modes.” (emphasis mine). However, the concept of enhancing safety appears sparsely across the SDD. Usually, the formulation “addresses the number and severity of crashes” is used. It’s not exactly clear to me what counts as “addressing” the issue.
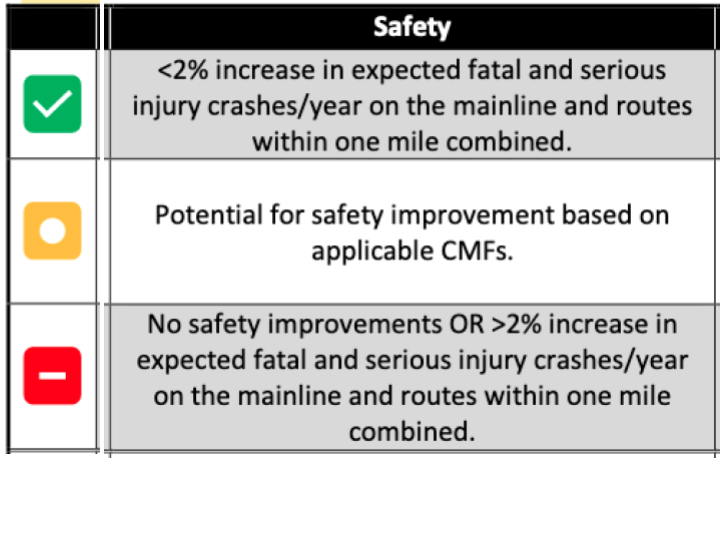
According to the SDD Evaluation Criteria document, the alternatives will be compared using a qualitative assessment which determines “yes/no” whether the alternative “addresses” safety. The “qualitative assessment” is intended to be made up of two considerations, the first of which is Crash Modification Factors (CMF). CMFs are a table of values that show how certain specific roadway design changes can impact crash safety. The other consideration is that “where CMFs are not applicable, this qualitative assessment will be based on average crash rates and modeled VMT [vehicle miles traveled] by facility type.” Multiplying the forecasted number of miles traveled on a certain road segment by the average number of crashes per mile traveled for that type of road results in an estimated number of crashes.
The Safety Analysis documents the calculation of predictions for both total crashes and severe crashes at multiple geographical scales, but the Scoping Alternatives Evaluation (SAE) explains that severe crash rates within the one mile study area were used for decision making.
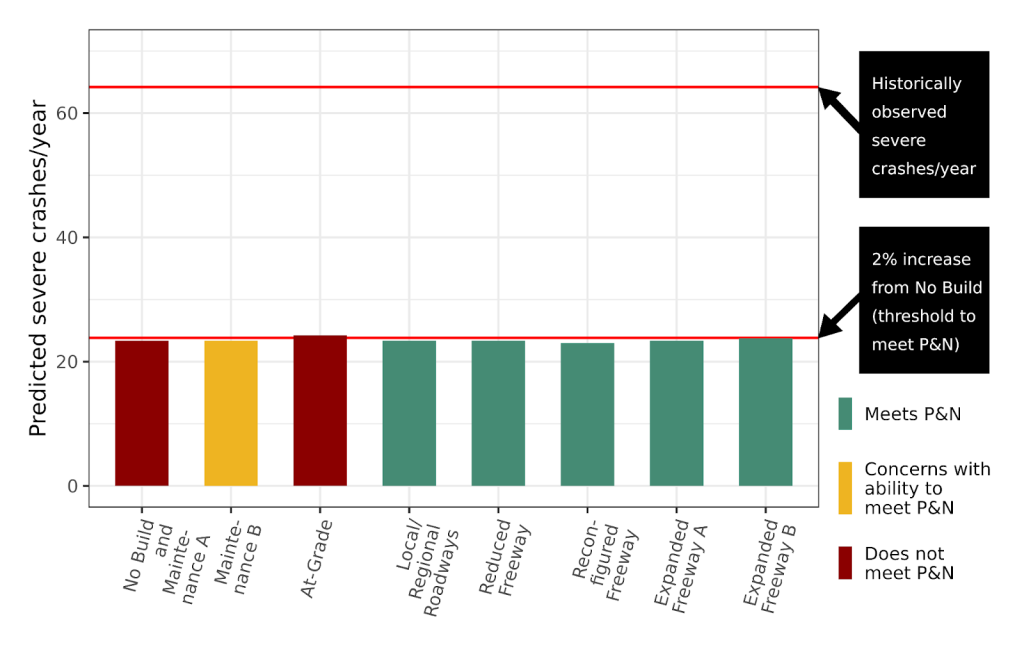
The SAE reports a narrative of how the alternatives perform on the qualitative assessment. The alternatives will be compared against No Build, so it’s important to know the crash prediction for No Build. This number is not in the SAE. Because the SAE is somewhat inconsistent, I used the Evaluation Matrices as a supplementary source for the final reported data, which is where I found that for No Build, “23.3-64.2” yearly severe crashes are predicted within the study area.
The thresholds for scoring are confusing, so I will take them one at a time, starting at the bottom. No Build and Maintenance A do not meet P&N for Safety because they make no safety improvements compared to No Build. The other condition for not meeting P&N for Safety is a greater than 2% increase in the severe crash prediction. In the Evaluation Matrices, At-Grade is predicted to have “24.3-67.2” yearly severe crashes in the study area, which is a reported “4.4%-4.7%” more than No Build. At-Grade fails to meet P&N based on this standard.
Next, let’s consider the opposite. In order to meet P&N for Safety, alternatives should achieve a less than 2% increase in the severe crash prediction. A footnote in the SAE explains that a 2% change is “considered neutral/no change.”
Alternatives which do not change the number of severe crashes meet P&N, while alternatives which make “no safety improvements” do not meet P&N. I asked Lopez, the MnDOT spokesperson, about why this less-than-2% increase in severe crashes threshold didn’t apply to the Maintenance alternatives for consistency with the others. He explained that the crash forecasts were calculated using a consistent method, but didn’t say anything about how they were compared.
To try to understand what’s going on here, let’s look at how to get a middle score of concerns with ability to meet P&N. One alternative got this score: Maintenance B. Maintenance B’s forecasting results are identical to No Build, but MnDOT argues that it could be safer because the shoulders will be widened by one to two feet, modifications which have associated CMFs.
According to the Alternative Safety Analysis, the original intention may have been to apply CMFs to more alternatives, but this turned out to be impossible because CMFs are only applicable within a narrow range of traffic volume change, and there aren’t really CMFs relevant to freeway removals. This creates the situation that, for all but one alternative, the “qualitative” safety assessment is actually a quantitative comparison of the severe crash prediction to No Build.
| Alternative | Reported predicted severe crashes in SAE (correct value in bold) | Reported percent change from No Build in SAE (correct value in bold) | CMF applied? | Score |
|---|---|---|---|---|
| No Build and Maintenance A | 23-64 (not included in SAE) | NA | No safety improvements | Does not meet P&N |
| Maintenance B | 23-64 | NA | CMFs for widened shoulders applied | Concerns with ability to meet P&N |
| At-Grade | 22-63 (typo in SAE, should say 24-67) | +4.4-4.7% | Not considered | Does not meet P&N |
| Local/Regional Roadways (4 access points) | 23-66 | -0.1% to +2% | Not considered | Meets P&N |
| Local/Regional Roadways (3 access points) | 24-67 | +1.4-3.9% (+1.6%) | Not considered | Meets P&N |
| Reduced Freeway | 23-63 | -1.9-2.8% (-2.8%) | Not considered | Meets P&N |
| Reconfigured Freeway | 23-63 | -0.9-1.2% | Not considered | Meets P&N |
| Expanded Freeway A | 23-64 | -0.1-0.8% | Not considered | Meets P&N |
| Expanded Freeway B | 24-65 | +0.9-1.5% | Not considered | Meets P&N |
The results of the quantitative comparison are that all alternatives which met P&N for safety were predicted to have a minimum of “23-63” yearly severe crashes in the study area, which ranges from a 2.8% decrease to a 1.6% increase in severe crashes.
Here it’s also important to explain that half of the predicted crash “data” presented in the SAE and Evaluation Matrices is not really what it seems. The predicted severe crash rates are point predictions, so it is not possible to have a ranges of predicted values or range of percent change from No Build. The result of multiplying predicted vehicle miles traveled (VMT) in the study area by the statewide crash rates is the lower number–23 or 24 yearly severe crashes, depending on the alternative. The higher number will be relevant later. I am not sure why there are two percentages–it’s not the same reason there are two crash predictions, which I’ll come back to later. I followed up with Lopez, the MnDOT spokesperson, to see if he could find out, but he did not have time to do so before publication. The percent change value I have identified as “correct” is the value calculated in the Alternative Safety Analysis.
In the SAE, both values are presented without explanation, in the same format shown here. In the Evaluation Matrices, they are rounded to one decimal, but also without context.
After thinking more about all of this, I started to suspect that the criteria for scoring the alternatives were chosen after seeing the results. How would MnDOT know that all alternatives which had valid CMFs would go in the Concerns category ahead of time? Why would meeting P&N not require a reduction in the predicted number of severe crashes?
I asked Lopez if the 2% cutoff was chosen before or after the analysis was completed. He skipped the question in his reply. If, in fact, the 2% cutoff was chosen after the analysis, the decision to use it could have been made by someone who consciously knew they were going to cause an alternative to not meet P&N.
A comment from the Our Streets FOIA request shows that Metropolitan Council staff were also a little confused about the basis of the scoring thresholds. The commenter wrote, “it is difficult for a non-safety expert to determine where and how safety measures represent significant findings and concerns and how the matrix breakpoints between a green, yellow or red safety rating were established.”
MnDOT responded that they had discussed the methods with “traffic safety specialists from MnDOT and FHWA [Federal Highway Administration],” and that “A consensus developed around the selected methodology as it was determined to provide a fairer comparison of the range of alternatives than the methodology originally proposed in the draft evaluation criteria memo.” The version of the Evaluation Criteria Memo that this comment refers to is not available in the FOIA documents, so I’m not aware of what the change in methodology is.
It’s also not clear to me how MnDOT’s response is meant to address the concern about the rationale for scoring thresholds. In this and other cases, including my correspondence with spokesperson Lopez, MnDOT has a pattern of responding to requests for technical explanations with an appeal to expertise. In response to my first round of questions, Lopez gave a statement which ended by saying: “Safety is one of several evaluation criteria. MnDOT’s analysis and modeling is based on industry standard. The recommendations on which alternatives should be further studied have been reviewed by local, state, and federal partners. These include the Metropolitan Council, the cities of Minneapolis and St. Paul, and Federal Highway Administration.”
Another strange thing is that the paragraph text explaining why alternatives met or did not meet P&N in the SAE is inconsistent. For example, for Local/Regional Roadways, the SAE reads that this alternative “would address the number and severity of crashes for people in motorized vehicles (cars, freight, and transit) by reducing the total expected crashes/year.” Total crashes include those without injuries or deaths. Local/Regional Roadways does meet the standard of less than 2% change in severe crashes, but this is not explained in the paragraph as a reason for meeting P&N. In comparison, the greatest predicted decrease in total crashes for any alternative was for the At-Grade alternatives, a 13% decrease. This is mentioned, but the increase in predicted severe crashes takes precedence because “while MnDOT works to decrease all types of crashes in Minnesota, fatal and serious injury crashes are the highest priority.”
The SDD implies that the alternatives can be made more safe through detailed design modifications at a later stage of the process. How much this would affect the safety in real life is uncertain, but I asked Lopez why MnDOT differentiated between alternatives with such small differences in scores based on rough designs. Lopez said that there would be an “equal opportunity to apply specific design elements with any of the alternatives,” but this didn’t really make sense to me either–the whole point is that alternatives have different designs on the I-94 corridor. Therefore, they’d have opportunities to apply different design elements.
Are the numbers reliable?
Despite the strange inconsistencies and omissions in reporting, the underlying method is based on a straightforward relationship between VMT and crashes: more driving creates more exposure to the risk of crashing.
The issue is that predicting the future introduces an inherent source of uncertainty: MnDOT doesn’t know for sure how many crashes will happen next week, let alone in 15 years. Events which forecasters wouldn’t be able to predict in order to use as input data can have an effect on how people choose to travel. As a major example, without the 2008 recession, traffic forecasts would have been more accurate.
The uncertainty in the severe crash predictions comes from the two sources: the VMT forecast and its own inputs; and the statewide average crash rates.
The VMT forecast
The VMT forecasts for each road link were made using an activity-based model (ABM), according to the SDD. ABMs are state-of-the-practice in predicting future traffic flows. They start by simulating the entire population of a region–their decisions about where to live, where to work, what to buy, who to live with, and what modes to travel with. The model that MnDOT uses for Rethinking I-94 is developed by the Metropolitan Council, and covers regional travel for the Twin Cities metropolitan area. The current architecture of the model has been used since 2014, and is expected to be replaced this year.
According to Johnathan Erlich, travel modeling and research senior manager at the Metropolitan Council, the federal environmental impact study process requires traffic modeling for all alternatives to be based on a consistent land use forecast, in this case derived from local comprehensive plans. I interviewed Erlich, together with Emma Sroda, a spokesperson, and Charles Goragantula, the principle data scientist/forecaster at the Metropolitan Council. Erlich told me that these official land use forecasts are “not accurate,” but they provide a good baseline for comparing between scenarios.
In the case of Rethinking I-94, this is a major shortcoming in the federal process because the main expected benefit of the freeway removal options is land use change. Changing land use would change the available destinations for traffic on the corridor, completely altering the demand to travel on the roads in the project area. Lopez, the MnDOT spokesperson, agreed that “if future land use changes lead to enough of a decrease in VMT, particularly on non-freeway roadways,” this could change the predictions by more than 2%. In other words, a known factor that is not accounted for in modeling has the potential to change the results by more than the threshold chosen to differentiate between alternatives.
Lopez explained that “MnDOT does not make land use decisions, and the I-94 project is not developing future land use scenarios.” However, he did point out that “the Tier 1 EIS will include substantial discussion of land use impacts–” meaning the next phase of the project, once the At-Grade alternatives have been removed.
Are traffic models good?
Sroda, the Metropolitan Council spokesperson, explained that the Council uses the regional travel demand model as “one of many tools available for decision making,” and gave examples of how the regional model can inform more detailed modeling of specific areas. She said that “the unexpected is always expected when meeting the needs of such a vibrant and diverse region.” Erlich explained that the models are best used for comparing the impacts of different scenarios, and wouldn’t be expected to provide an accurate point forecast.
This might not be the response that planning agencies would have given a few decades ago. For most of the 20th century, some scholars argue that the US was planned within the paradigm of “predict and provide.” In predict and provide-style planning, planners first have an idea to build or expand a road. Then, they forecast that the capacity of the road will be filled up with traffic, creating the prediction, and finally they provide the road.
In many cases, predictions of new lanes filling up with traffic are accurate, in part because of induced demand. In the short term, drivers switch from alternate routes and in the long term, land use change follows road networks. When forecasting traffic, it can be difficult to tell what proportion of traffic would have existed without new infrastructure, and what proportion has been induced.
Like most other “objective” tools, traffic models can be used to advance pre-existing political goals. Realistically, this might not be a bad thing. Choosing what kind of future scenario to work towards will always be a political decision, and forecasting can help create a better understanding of the possible consequences. As the Metropolitan Council staff explained, this does require a recognition that the future is always unexpected.
What kind of traffic situation is MnDOT predicting?
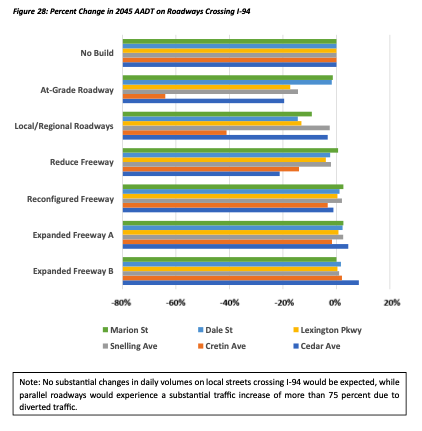
The At-Grade alternatives are special because of the inverse phenomenon of induced demand: reduced demand or traffic evaporation. According to the Traffic and Transit Analysis, MnDOT’s modeling predicts a baseline 2045 scenario of 1,364,000 yearly vehicle miles traveled (VMT) on I-94 and parallel arterial routes with the No Build alternative. The At-Grade alternatives are predicted to reduce this to 791,000, nearly halving the miles traveled in the east-west direction. While this is subject to uncertainty, the difference between the two scenarios is so large that some reduction is worth planning for. This VMT dropoff would have a clear benefit of reducing the concentration of air pollutants around the I-94 corridor, although there would likely be some spreading of pollution around different routes in the area. The predicted increases in traffic volumes on surrounding roads are proportionally many times smaller than the decrease on I-94, though.
The other alternatives are much less drastic. The prediction for Reduced Freeway is a slight decrease in freeway VMT and increase on parallel streets, while Expanded Freeway could result in a slight increase in freeway VMT. However, at the scale of the entire Twin Cities metro, the Traffic and Transit Analysis concluded that none of the alternatives, including At-Grade, would meaningfully change VMT.
Getting from VMT to crash rate
If all roads were the same, reducing VMT would always reduce the amount of crashes. However, surface streets have more crashes per VMT than freeways on average in Minnesota, according to the crash rates used in the Alternative Safety Analysis. This means that alternatives which reduce freeway capacity may result in more crashes on nearby roads due to traffic diversion.
While the Traffic and Transit Analysis predicts that the At-Grade alternatives reduce the total amount of driving, they also switch freeway driving over to the surface boulevard that replaces I-94 and parallel routes. Despite this, the crash forecast presented in the SDD is strikingly similar to the other alternatives. Total crashes are predicted to decrease by 13% within the one mile study area. While the amount of yearly severe crashes is predicted to be 4.4% more than No Build’s, it’s difficult to draw any conclusions without knowing the uncertainty of these predictions.
Besides ignoring land use change, there is another major factor that the traffic modeling couldn’t account for: according to the Traffic and Transit Analysis, Minneapolis is planning lane reductions on surface streets. This would have unpredictable results on the travel demand modeling, but clear benefits for safety overall: roads with fewer lanes have both lower crash rates and lower capacity for VMT. While this safety benefit would apply to all alternatives, it may not have an equal effect on the severe crash forecast because of network-wide effects on where and how much travel is predicted.
Forecasting uncertainty
The SDD claims that uncertainty has been addressed by applying a ±2% window to the results. This number is best explained in the Alternative Safety Analysis:
“The model can give a broad, qualitative indication of the traffic diversion that would occur with the alternatives, but its accuracy in estimating link-level volumes is limited, particularly for lower-volume, lower-functional class roadways. To account for this uncertainty, increases or decreases in crashes of less than 2 percent were considered neutral or no change from No Build in the evaluation of alternatives.”
Leaving aside that this is still not the definition of “qualitative,” there is no attempt to explain how much uncertainty to expect, nor an explanation of why 2% was chosen. Elsewhere in the SDD, there is even less detail. The word “uncertainty” is not used at all in the main SDD, the SAE, or the Traffic and Transit Analysis, although the latter does include some qualifying language on small predicted differences. Across all of the documents, words which express certainty like “will” and “would” are used almost exclusively when referring to forecasted conditions.
I asked Lopez, the MnDOT spokesperson about where the 2% number came from twice. The first time, he said that “the 2% interval was used for the safety analysis to be consistent with previously reported analysis of mobility criteria for the alternatives based on results from the regional model,” the same thing MnDOT had written in response to comments about uncertainty on an earlier draft of the SDD.
The current version of the Traffic and Transit Analysis does not use a defined uncertainty window, a choice which makes its conclusions a little ambiguous–but it generally considers changes in VMT of well over 2% to be “no substantial change.” One example of this is that predicted traffic volume reductions of 15-20% on roads which are relevant to the safety analysis are determined to be insubstantial.
Since the 2% value is not in the Traffic and Transit Analysis anymore, I asked Lopez for clarification. He then explained that “the 2% threshold was selected in coordination with a traffic working group that included representatives from FHWA, Metropolitan Council, the cities, and counties.”
A summary of meeting minutes from the Rethinking I-94 Traffic Working Group mentions that consulting firm WSG did develop a “sensitivity analysis to test traffic diversion assumptions in the regional model.” Some kind of map was produced as a result, and the group decided that this would be included in the “memo,” which I believe refers to the Traffic and Transit Analysis Memo. However, I did not find the map in the current draft of the document.
According to MnDOT’s own advice from 2009, a range of values from the sensitivity analysis should be reported where point estimates would otherwise be used. Whatever analysis may have taken place is not useful to readers when we cannot see its results. As another paper put it, “whereas a point-forecast 15% different from the post-opening count might be viewed as inaccurate, the same forecast may be viewed as accurate if it were reported with a range of ±20%.” Lopez was not able to respond to a question related to this topic in time for publication.
How to actually find out about forecasting uncertainty
Uncertainty is closely related to the model accuracy. In 2040, the prediction year for the Rethinking I-94 models, it will be possible to make traffic counts, and retroactively compare the observations to the forecasts. The difference in forecast and observation is the forecasting error. Before 2040, it is only possible to guess what the forecasting error will be. Uncertainty is the proactive estimation of forecasting error.
This lag in finding out about accuracy means that there are not many results available on the accuracy of contemporary ABMs. Earlier regional travel demand models used a less sophisticated method of assigning trips. One of the most recent studies on the accuracy of transportation forecasting does not differentiate between the different possible types of regional travel demand model, meaning that the Rethinking I-94 predictions could be more likely to be more accurate. This study considered a wide sample of projects across the US and Europe, and compared forecasted traffic counts to the actual value that was eventually recorded. For projects that used regional travel demand models, the average aggregated forecast of all segments within the project was off by an absolute value of 16.9 percent. A forecast worse than 90 percent of others would be off by 36 percent. Because half of all forecasts are worse than average, using an uncertainty window wider than the average forecast error would minimize the risk
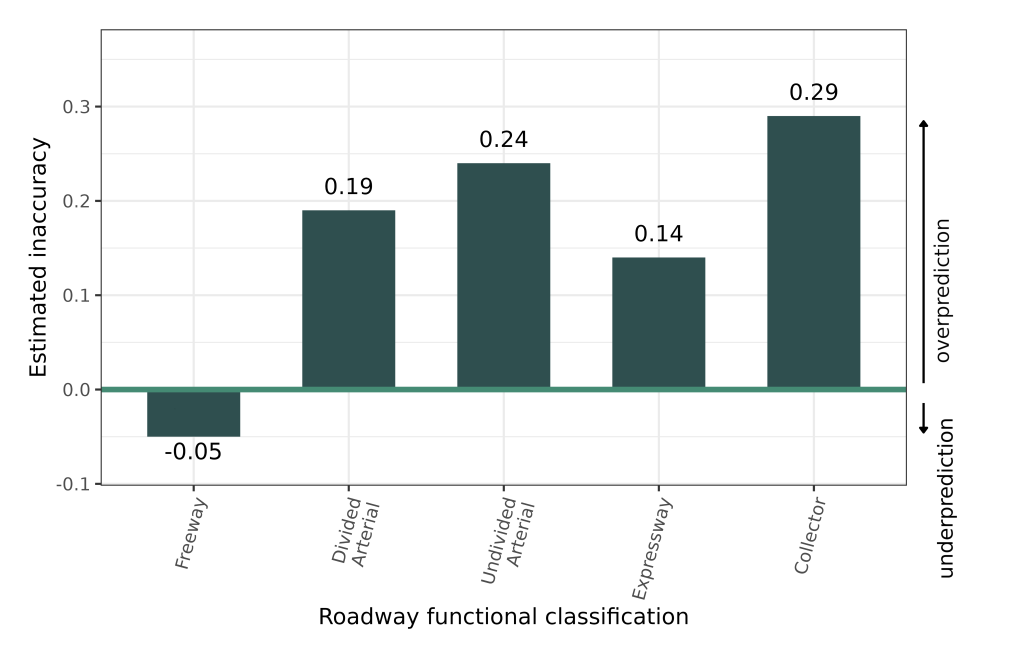
The 2009 MnDOT report on the accuracy of traffic forecasts in Minnesota found that forecasts in Minnesota have historically been less accurate than this, although the report includes forecasts going back to the 1970s made with rudimentary models. Aggregating all segments across all projects, The average forecast in Minnesota prior to 2009 was a 14.3% overprediction. Because overpredictions and underpredictions cancel out when aggregated, this would be higher if the absolute value was used, as was done in the international study. The Minnesota study also split up roads by type, which reveals that forecasts in Minnesota have been too high for all types of roads except freeways.
The Metropolitan Council’s principal data scientist/forecaster, Charles Gorugantula, couldn’t share any details of an upcoming new report scheduled for next summer during our interview, but did say that the forecasts have improved.
In all Rethinking I-94 alternatives, the Alternative Safety Analysis shows that most of the predicted crashes within the one mile study area occur on roads other than I-94. This includes small segments of other freeways, but most of the roads in the study area are not freeways. Average traffic forecasts for these lower functional class roads have been 14% to 29% overpredictions in Minnesota, according to the 2009 study. I find it far outside the realm of plausiblity that new forecasts have gotten this accuracy down to within 2%, where it would need to be to use that as a threshold for decision making–especially when considering the main source of uncertainty in traffic forecasts.
What causes inaccuracy?
Models can be inaccurate either because the model makes an inaccurate assumption about how inputs are related to outputs, or because the input data is inaccurate.
According to research, the latter case is a bigger factor in traffic modeling. Translated to uncertainty, the main source of uncertainty in modeling outputs is due to the uncertainty in the inputs. The 2009 MnDOT report explains that “errors in model inputs such as demographic forecasts, trip making characteristics and network differences contributes [sic] to the total inaccuracy in roadway forecasts.” Because the model is based on simulating individual members of the region’s population, modelers need to first forecast information about the future population of the region.
As an example, one input is the cost of travel, which would change based on gas prices, vehicle ownership cost, transit fares, and how much people value their time. Gas prices do affect driving behavior–one study found that a 12% gas price increase would be expected to reduce VMT by 2% a year later. Valuing time differently matters a lot for mode choice as well–an oversimplification would be to consider whether simulated people should choose to spend extra time on a bus to save money. Exactly what this value of time should be is not something experts agree on.
If any of the input forecasts are off, the traffic forecast will also be off according to the 2009 MnDOT report–but the models are so complex that we don’t know ahead of time exactly what this relationship is. The uncertainty window is important partially because a changed input might increase VMT in one alternative scenario, and decrease it for another.
Multiple sources agreed that ABMs have higher uncertainty on any one specific road segment than for multiple aggregated segments. Besides the general level of complexity, there is a technical limitation for the detail of ABMs on specific road segments. One of the major unsolved issues with predicting traffic on individual road segments is the lack of dynamic traffic assignment. ABMs currently use static traffic assignment, where a traffic jam on one segment will not affect the segment behind it. This creates an unrealistic prediction of varying conditions from one block to the next. A report commissioned by Our Streets tested this, and found that the Metropolitan Council’s model was not all that good at predicting actual traffic speeds on I-94, measured in 2022. In the highly congested I-35W/I-94 overlap area, eastbound afternoon traffic moved at about 20 miles per hour in real life, but the model predicted a seesaw of speeds that were about right and speeds above the 55 mile per hour speed limit.
According to a Metropolitan Council comment in the Our Streets FOIA documents, “static traffic assignments are notoriously unreliable at estimating volumes on low-volume, low-functional class roads… While the travel forecasting runs demonstrate significant traffic diversion in the at-grade alternatives, the precise magnitude of diversion on any particular road is hard to measure with static assignment models.”
MnDOT’s response pointed out that the limited accuracy was already mentioned elsewhere in the SDD, and that “follow up discussions will take place regarding traffic modeling and sensitivity testing.” Whatever the result of these discussions was did not make it into the final Traffic and Transit Analysis Memo.
Adding dynamic traffic assignment to the regional model is a suggestion that has gained some traction in the Twin Cities. However, making the model more precise would not replace the need for understanding the uncertainty, due to the remaining input uncertainty.
Understanding the uncertainty
One of the recommendations in MnDOT’s 2009 report was to make multiple modeling runs with different input values to test sensitivity. This would generate a range of different forecasted values, and the entire range would be useful to decision makers. Using a range would give an understanding of the best and worst case scenarios, and any potential overlap between project alternatives. It’s unclear if WSG may have shared sensitivity testing results internally with MnDOT based on the Traffic Working Group meeting summaries.
Gorugantula, from the Metropolitan Council, told me that the history of travel models has made it difficult to put analysis of uncertainty into practice. Forecasting models were first developed to inform the build-out of the interstate highways, and at the time, point estimates were considered adequate. Gorugantula pointed out that there has always been interest in trying to understand the causes of variability in model outputs, but he said there has not been a lot of application. He puts this down to two factors: it takes a lot of resources to run the models; and the input variables are themselves complex, with their own associated uncertainties.
There are new tools available which give an idea of the variability without extreme computational requirements. Since 2021, the Federal Highway Administration has had a tool available to automate a few model runs with varying inputs and create a picture of the range of possible outputs. This tool provides ways to get insight into which inputs have the most impact on the results, and allows planners to explore a range of future scenarios. Another innovative option, published the same year, is to use the historical accuracy of the model to estimate a range around new estimates.
MnDOT’s crash estimates are also just wrong in an obvious way
One of the biggest mysteries of the SDD for me was why there is what looks like a range of two numbers for predicted fatal and serious injury crash rates, either about 23-64 or 24-67 depending on the alternative. My first thought was that this was a confidence interval, because that’s usually what it means when two numbers are presented as a range like this. But, if that were the case, where would the interval be coming from and why would that not be reflected in the percent changes reported?
The truth is much stranger. If you’ve been wondering why the predicted crash rates are in the low twenties, when the historical average severe crashes per year is 64.2, this is why.
The Safety Analysis team found that “I-94 is not typical of the roadways in the statewide averages.” Using these statewide crash rates caused the crash forecasting method to underpredict the amount of yearly severe crashes by more than 60%, so the team assumed that the percent differences between alternatives would still be about right, and scaled the predictions so that No Build would match the historical rate. Both the small number and the big number then got packaged up and pasted everywhere the crash rates are referenced, except for at least one place where there is a typo. The only time this is even mentioned in the entire SDD is on pages 16 to 18 of the Alternative Safety Analysis, under a small heading. Elsewhere, the range of 23 to 67 is repeated out of context.
The crash rates are too low for the Twin Cities, but they are also quite coarse in differentiation between road types. Many roads in the study area that are technically the same type could be experienced differently due to lane widths, bike lanes, curves, block lengths, and intersection design. Averages should account for variation in roads, but the variety in this area is unusual for the state. Some roads may even have a number of lanes that doesn’t match any category in the table well–is a light rail the same as a normal lane divider? What about one way streets, or whatever you’d call this stretch of Lexington:
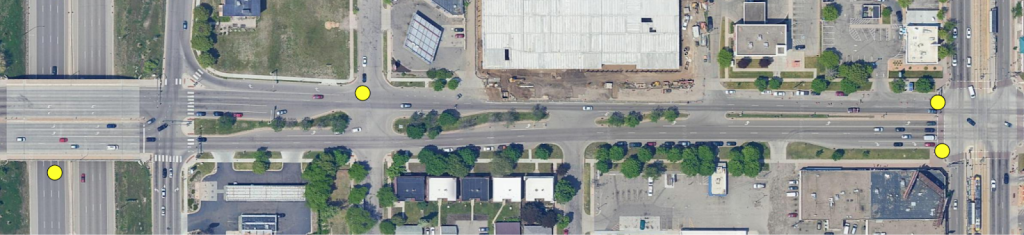
Lopez, the MnDOT spokesperson said that the state-wide data was used “for consistency,” and that one way streets were “incorporated into the analysis.” There is no mention of one way streets in the Alternative Safety Analysis.
Lopez also defended the overall methodology saying that “rates on many of the parallel routes are above the statewide averages, which would suggest even greater crash problems with alternatives that reduced capacity/put additional traffic on local roadways,” and “at a scoping level, the statewide rates give the context needed to understand a comparison between the alternative and no-build conditions.”
MnDOT is assuming that even if the statewide rates are incorrect, this wouldn’t change the comparison between alternatives. However, when dealing with less than five percent predicted differences between alternatives, it is mathematically possible that this wouldn’t hold up. Because the crash rate is broken up across at least eight types of roadway in the study area, slightly varying the crash rates could cause alternatives with different mixes of these eight roadway types to have a changed final result.
Minneapolis and Saint Paul have had questions, too
Lopez, the spokesperson for MnDOT, told me that the recommendations had been reviewed by local, state, and federal partners, including the cities of Saint Paul and Minneapolis.
In an email to a Streets.mn contributor, a spokesperson for the city of Minneapolis shared a letter that senior staff from the Departments of Public Works, and Community Planning and Economic Development had sent to MnDOT.
The staff had an intuition that the safety analysis was inadequate. They asked, “does MnDOT typically use statewide averages for each facility type to forecast crash potential, as has been done for this project? As there is only one facility type for ‘Urban Freeway,’ all freeway alternatives are assumed to have the same crash rate in this project’s analysis. There should probably be more nuance in the safety analysis that could further differentiate the crash rates among alternatives depending on the size/configuration.” The Alternative Safety Analysis does not explain why these were reasoned to be appropriate assumptions, but I did not see MnDOT’s response to the letter.
The Minneapolis City Council has passed multiple resolutions expressing goals which conflict with the Draft SDD. In a 2024 resolution, they ask MnDOT to “disclose the margins of error and/or uncertainty of traffic models when sharing modeling results with members of the public and government partners.” In their comments on the draft SDD the Minneapolis City Council ask outright to advance the At-Grade alternatives for further study.
Saint Paul’s only City Council resolution on the project that I am aware of is comparatively vague to resolutions passed in Minneapolis. However, Saint Paul city staff whose comments on the safety analysis were included in the Our Streets FOIA document do mention “margin of error” and similar concepts a few times, to which MnDOT replied that the 2% window would be added.
These comments indicate a colloquial use of technical terms, which leads to potential confusion. Resources that I reviewed on forecasting uncertainty don’t use the term “margin of error” because the concern is whether the forecast will be accurate to a future that can’t be measured yet. Margin of error in statistics is related to the differences between a sample and a population. I think it is safe to assume that the commenters mean a margin based on some kind of knowledge about the forecast uncertainty–and I have seen no evidence that the 2% window would have any relationship to the forecasting model.
In an email to a Streets.mn contributor, spokesperson for the city of Saint Paul confirmed that the city reviewed the Rethinking I-94 recommendations, and said they found “no substantive limitations” in the methodology used to differentiate between the alternatives. Saint Paul Assistant Mayor Nick Stumo-Langer gave a statement which confirmed that the city followed City Council priorities, and reads in part, “while we continue to advocate for options with a smaller footprint, drawing on our technical expertise and experience working in the City’s built environment, we remain committed to engaging in the alternatives that are moving forward.”
Other cities have successfully enhanced safety
I like to use the example of Helsinki, Finland as a comparison for the Twin Cities. Helsinki is a city of 674,500 with an area of 84 square miles, both only slightly smaller than Minneapolis and Saint Paul combined. The seasonal weather is similar, but there is one major difference. Helsinki had zero traffic deaths in 2025. This was not always the case. Helsinki went from 727 traffic-related injuries in 2003 to 14 in 2023. Planners there blame two factors: reducing vehicle traffic speeds and shifting travel to other modes. Finland also treats fatal crashes as anomalies to investigate, similar to how air crashes are treated in the US. When investigators find a root cause in a roadway design, the road will often be changed.
For shifting travel to modes other than cars, Helsinki is starting with a leg up on the Twin Cities. Rather than building an extensive freeway network in the 1970s, the city preserved its streetcars [source in Finnish with nice pictures] and invested in a heavy rail subway, which now carries over 200,000 passengers per day.
According to the Traffic and Transit Analysis, MnDOT thinks less than 10,000 people would use a 94 bus in the most ambitious scenario. This is pessimistic because they haven’t modeled land use change along I-94, so an At-Grade conversion would generate more trips to destinations along the corridor. However, it’s pretty clear that the transit options being offered are not going to come close to serving the theoretical demand for trips, and I’ll address this in Part 4.
People will argue that it’s unrealistic to expect European-style safety improvements in an environment which has been planned by American planners for a century. I agree that this is true, but it’s also not an argument to keep planning like Americans. If we take the name seriously, Rethinking I-94 should be an opportunity to start digging our way out of a path dependency cycle on transportation options.
The bigger picture
The Draft SDD safety analysis has a level of uncertainty which can’t plausibly differentiate between the alternatives, but there is one part of the conclusion that passes the gut check: it makes sense that designs which resemble existing infrastructure in the Twin Cities wouldn’t improve safety over what we already have. The Draft SDD is a reminder that the Twin Cities’ streets are a safety crisis, with crash rates much higher than the statewide averages. As many community members have been saying, MnDOT’s vision of actually Rethinking I-94 is incredibly limited.
Making decisions based on traffic models like this is also philosophically challenging, which I touched on in Part 1. If all of the project alternatives had the same benefits, it might make sense to compare apples to apples and pick the one with the most optimal forecasting results, but that’s not what’s going on here. The At-Grade alternatives are meant to add functions to I-94 which a freeway does not have–community space, housing, neighborhood cohesion. This doesn’t mean we should just accept death and destruction, but it’s important because the argument doesn’t work in reverse. MnDOT isn’t proposing to replace Selby and Franklin with freeways, even though that would certainly reduce the number of conflict points between vehicles.
Minneapolis is ahead of the game in this respect, with plans to reduce capacity on streets, negotiate changes to freeway entrances and exits, and even push to have other freeways removed in the city. Minneapolis wants 60% of trips to be taken by a mode other than car by 2030. The city is preparing for a future where the road capacity won’t be needed, and the safety benefits of VMT reduction can be realized, a similar strategy to the one Helsinki followed.
Come back for Part 3 to see how MnDOT did with the Mobility analysis, and Part 4 for my thoughts on the questions Rethinking I-94 isn’t asking.
Acknowledgement: Jackie Lin assisted with quantitative interpretation, made edits for clarity, and provided moral support.