When we open the Transit app or pull up a street map on our phones, our instinct is to treat what we see as neutral facts. We expect street grids to report geometry, blue polygons to trace Bde Maka Ska and Lake Harriet, and shaded parcels to tell us what simply is. But maps also tell us what was—and what can be.
A map is a selective, political argument. Every cartographer chooses what to magnify, what to label, and what to erase. In urban planning, maps do not merely document the terrain under our feet; they actively construct the social and physical landscape of the future.
To understand why the Twin Cities look, move, and segregate the way they do today, we have to treat historical maps not as quaint civic archives, but as blueprints of power. If we want to build a more just Minneapolis tomorrow, we have to recognize how cartography was weaponized against our neighborhoods—and how we can reclaim it.
The Cartography of Exclusion: Minneapolis in the 1930s
In 1933, the federal government established the Home Owners’ Loan Corporation (HOLC) to help homeowners facing foreclosure during the Great Depression. Beginning in the mid-1930s, HOLC’s City Survey Program developed color-coded Residential Security Maps for cities across the country, including Minneapolis. The maps classified neighborhoods according to perceived mortgage-lending and investment risk, drawing on assessments shaped by local real estate practices and racial prejudice.
The four-tier grading system—green (Type A, “Best”), blue (Type B, “Still Desirable”), yellow (Type C, “Definitely Declining”), and red (Type D, “Hazardous”)—did not simply evaluate the physical condition of housing. It also reflected race, class, and discriminatory assumptions about who belonged in particular neighborhoods.
- Near North Minneapolis: Historically redlined areas of North Minneapolis, including portions of Near North, were classified as hazardous investments. Black and Jewish residents faced discrimination in housing and lending, while redlining reinforced the neighborhood’s exclusion from opportunities for investment and wealth-building.
- The Southside Corridor: In South Minneapolis, neighborhoods with Black residents and working-class communities received lower security grades. Areas surrounding the historic Black community along Fourth Avenue South, as well as parts of Central and Phillips, experienced patterns of discriminatory housing policy and disinvestment.
- The Neighborhoods Around the Lakes: Conversely, many neighborhoods surrounding Lake of the Isles and Lake Harriet received more favorable classifications. These patterns overlapped with areas shaped by restrictive racial covenants, which had already limited where Black residents and other people of color could live. The University of Minnesota’s Mapping Prejudice project documents how these covenants helped produce the city’s enduring patterns of residential segregation.
Racial covenants and redlining were distinct mechanisms of exclusion. Covenants restricted who could purchase or occupy particular properties, while redlining classified neighborhoods through a discriminatory system of perceived investment risk. Together, they reinforced a geography of racial privilege and exclusion.
The lines drawn on residential security maps nearly ninety years ago reflected and reinforced decisions about which neighborhoods were considered worthy of investment and which were not. Their consequences extended beyond mortgages and property values. They contributed to a landscape in which some neighborhoods accumulated wealth, amenities, and political influence while others were denied those same opportunities.
From Red Lines to Concrete Trenches: I-35W, I-94, and the Highway Era
The inequalities recorded and reinforced by redlining maps did not disappear when the maps were filed away. Decades later, interstate highway construction followed a different planning process but reproduced many of the same patterns of racial and economic exclusion. In Minneapolis, routes designed to improve regional automobile travel displaced residents, disrupted businesses, and divided neighborhoods already constrained by discriminatory housing policies.
- The Severing of South Minneapolis via I-35W: When Interstate 35W was constructed through South Minneapolis beginning in 1959, it cut through the historic Old Southside community, a thriving, racially integrated neighborhood with an important Black residential and commercial presence. The Black business district around Fourth Avenue South and 38th Street was a center of community life. The freeway’s construction demolished homes and businesses, displaced residents, and created a physical barrier that further segregated neighborhoods to its east and west. Research from the University of Minnesota’s Where Did They Go? project documents how displaced Black families faced significantly more restricted housing options than white residents.
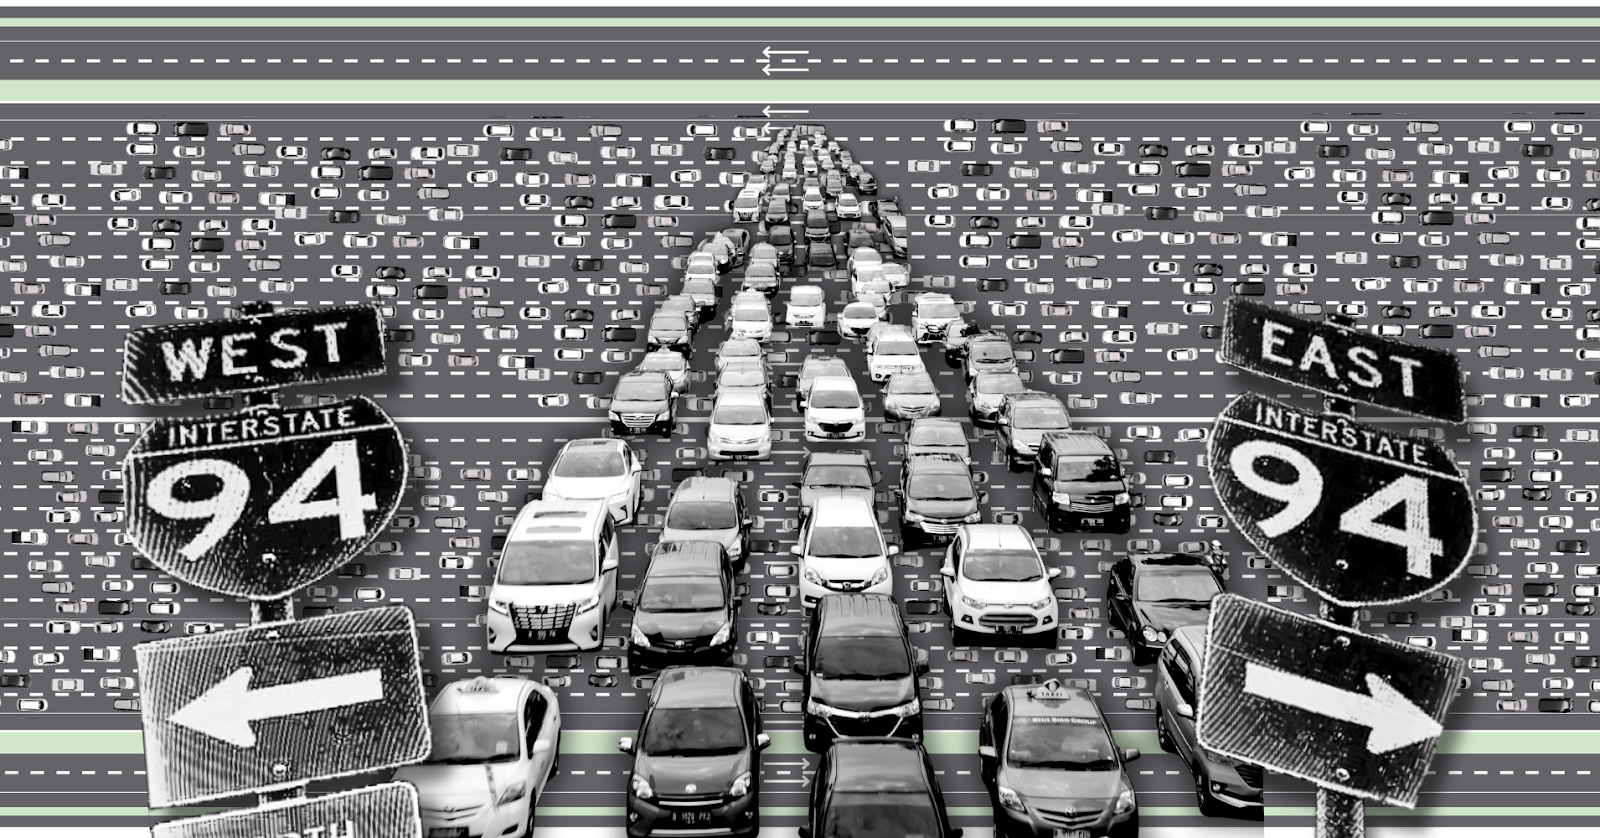
- The I-94 Trench and Olson Highway: Interstate 94 and Highway 55 also transformed the geography of Minneapolis. While the destruction of St. Paul’s Rondo neighborhood is well documented, highway construction and expansion in Minneapolis likewise displaced residents, altered street networks, and intensified barriers between neighborhoods. Olson Memorial Highway became a major automobile corridor between North Minneapolis and downtown, prioritizing regional traffic movement through communities already affected by discriminatory housing and investment practices.
- The Erasure of the Twin City Rapid Transit Grid: Before the automobile became dominant, Minneapolis and St. Paul were connected by an extensive streetcar network operated by Twin City Rapid Transit. Streetcars served major corridors, supported neighborhood storefronts, and provided mobility without requiring private automobile ownership. As streetcars disappeared and regional transportation planning increasingly prioritized highways and suburban automobile travel, the geography of mobility changed. Streets and corridors that had connected neighborhoods became increasingly organized around moving cars through them.
The University of Minnesota’s research into highway displacement demonstrates that these decisions were not simply questions of engineering. They were decisions about land, power, and whose homes and communities could be sacrificed for the mobility of others.
Highways were presented as progress, but progress for whom? A faster commute for suburban drivers came at the expense of homes, businesses, neighborhood connections, and opportunities for residents whose communities were placed in the path of construction.
Why We Must Study Maps
If we treat maps solely as turn-by-turn navigation on our dashboards, we miss the spatial logic that structures our daily lives. Studying mapping matters for three fundamental reasons:
- Maps reveal historical intentionality. Spatial inequality in Minneapolis is not simply an accident of geography or personal preference. Historical maps, planning records, and land-use decisions reveal how public policy and private discrimination helped shape the physical environment. The Mapping Prejudice project reports that Minneapolis neighborhoods historically protected by racial covenants are, on average, approximately 10 degrees cooler than historically redlined neighborhoods. Differences in tree canopy and access to green space demonstrate how the consequences of past investment decisions continue to shape present-day environmental conditions. Disinvestment was not inevitable. It was a political and economic choice, and its consequences remain visible on the map.
- Maps document what has been erased. Archival transit maps, historical street grids, and property records allow us to see neighborhoods as they existed before freeways, demolition, and redevelopment. They reveal homes and businesses that have disappeared, streets that were disconnected, and transportation networks that once offered different ways to move through the city. These maps remind us that today’s urban landscape was not inevitable. Other possibilities existed before, and others can exist again.
- Maps expose institutional priorities. A regional transportation map reveals where public agencies prioritize investment, which communities receive frequent transit service, and which corridors are designed primarily to move automobiles. The contrast between investments in highway infrastructure and the need for reliable, frequent neighborhood transit raises important questions about whose mobility is valued. Maps make power structures visible, including the choices made by the Metropolitan Council, the Minnesota Department of Transportation, local governments, and state lawmakers.
Studying maps means learning to ask different questions. Not simply where a road goes, but why it goes there. Not simply where housing is concentrated, but who was allowed to build wealth in one neighborhood and denied that opportunity in another. Not simply where a transit route ends, but whose ability to move through the city is constrained by that decision.
Mapping as an Act of Future-Building
Cartography was used to segregate and pave over Minneapolis, but it is also one of our sharpest tools for repair.
The Mapping Prejudice project demonstrates how historical records can be transformed into publicly accessible maps that expose discriminatory practices once buried in property documents. By making the geography of racial covenants visible, the project provides communities with evidence to understand the history of their neighborhoods and challenge its continuing consequences.
When grassroots coalitions advocate for the Twin Cities Boulevard as an alternative to the I-94 trench, they use maps and spatial analysis to show how highway removal could reconnect street grids, create opportunities for housing, and restore green space. The proposal remains contested within the state’s Rethinking I-94 planning process, illustrating how decisions about the future of transportation continue to be political battles over land, public investment, and community priorities.
When urbanists advocate for connected, year-round protected bikeways along corridors such as Lyndale, Hennepin, and Franklin, they use spatial data to identify dangerous intersections, gaps in existing infrastructure, and opportunities to make travel safer. When Minneapolis adopted its 2040 Comprehensive Plan, maps were central to debates over housing density, land use, and the city’s longstanding patterns of exclusionary zoning. Even as the city begins planning for Minneapolis 2050, these questions remain unresolved: who gets to shape the future of our neighborhoods, and whose priorities will determine what gets built?
Every line drawn on a city map is an ethical claim. It declares who belongs in a neighborhood, whose commute is prioritized, and whose lungs will absorb the exhaust.
If we want to build a Minneapolis that is walkable, transit-rich, and equitable, we cannot afford to treat maps as neutral pictures of what exists. We must read historical maps to understand the decisions that shaped our neighborhoods, examine contemporary maps to question whose priorities they serve, and insist that the people who live with the consequences have a meaningful role in drawing the lines of what comes next.