
A bus in the snow.
In the last post, I discussed which foreign cities are most like Minneapolis in terms of population distribution. In this post, I’m going to present some numbers about the transit systems of those cities, in order to determine how extensive Minneapolis’ transit system could be, given the distribution of its population.
Transit share in New York City is 56%. Various dense American cities like Washington, Chicago, San Francisco, and Boston have transit shares around 27-36%. Minneapolis is at about 14%. However, the calculation of transit share is often difficult to ascertain in other countries due to methodology differences. An easier metric for comparison is overall system ridership for high frequency rail, tram, and bus lines; compared to population. In Minneapolis, the two light rail lines had 23.8 million riders in 2017 on 35 km of rail (US and Canada ridership from APTA reports: Q4). Including buses, ridership was 81.1 million. Commuter rail (the Northstar) adds another 0.8 million riders.
For the other cities in our list, here are some comparison numbers:
Calgary: The CTrain light rail system had 88.0 million riders in 2017 on 60 km of rail. The overall transit system had 157.5 million trips including buses.
Brisbane: Brisbane’s rail system, Queensland Rail City network had 52.4 million riders in 2015/2016 on 689 km of rail. This is a primarily suburban rail system. A BRT network centered in the city had 70 million riders per year on 27 km of dedicated busways. The entire TransLink network saw 178.3 million trips in 2010-2011. It is important to note that this system extends much further from the main city than many of the other systems on this list, so neither the suburban rail or bus networks outside the BRT will be considered.
Ottawa: Ottawa’s OC Transpo had 134.5 million riders in 2016. Of these, about 2/3 were served on BRT lines with dedicated busways (the Transitway system); there are 26 km of dedicated bus lanes, but total route length for Transitway is 60 km, so the BRT is not strictly fixed-route. There is also a light rail line (Trillium) with 4.2 million annual riders on 8 km; a second line is opening later this year.
Zurich: Verkehrsbetriebe Zurich operates trams, trolleybuses, and regular buses. The tram and trolley fixed route systems carry 268 million passengers on 173 km of track. The buses carry an additional 37 million passengers in the urban network.
Nottingham: Nottingham Express Transit is a light rail system with 16.4 million annual riders on 32 km of track. Nottingham City Transport’s 67 bus routes carry 51 million additional people.
Sheffield: Sheffield SuperTram is a hybrid tram and light rail with 12.6 million annual riders on 29 km of track. The local bus routes are privatized (?!?!) so I was unable to compile good bus ridership data.
Mannheim: Mannheim, together with adjacent cities Heidelburg and Ludwigshafen, form a region called Rhein-Neckar. In Germany, urban rail systems are generally divided among trams in the densest city centers, U-Bahn that operate at higher speeds and partially underground, and S-Bahn suburban rails, which may extend 100 km or more from large cities. We will focus on U-Bahn and tramways, ignoring the regional rail networks. There are two separate transport companies that do travel within the main three cities of Rhein-Neckar. Straßenbahnnetz Mannheim/Ludwigshafen is a tramway with 83 km of track and is part of the Rhine-Neckar-Verkehr network with 161 million total riders between tram and bus. I could not find figures that distinguished ridership between tram and bus. The Busverkehr Rhein-Neckar is an alternative bus network carries 44 million passengers per year.
Stuttgart: Stuttgart’s Stadtbahn is a light rail or tram system with 174.9 million riders on 130 km of track. Given that all but one of the lines run underground at some point, and 14 downtown stations are underground, this system could be considered a U-bahn equivalent. The bus network has 190 million passengers per year.
Antwerp: Antwerp’s tram system has 128.9 million riders on 82 km of track. This system includes about 12 miles of tunnels; so, as with Stuttgart, it is more of a subway system than a light rail. The underground parts are called the Pre-metro. I couldn’t find any information on buses.
Nuremberg: Nuremberg has a large, integrated regional transit network called Verkehrsverbund Grossraum Nuremberg that offers U-Bahn, S-Bahn, and tramways. The U-bahn serves mostly the city limits and carries 128.9 million riders on 37.1 km of track. The trams carry 39.2 million passengers on 38 km of track. A neat integrated system map is found here. The bus systems of Nuremburg and adjacent Erlangen carry 59.8 million passengers per year; there are other bus companies that operate in the area as well.
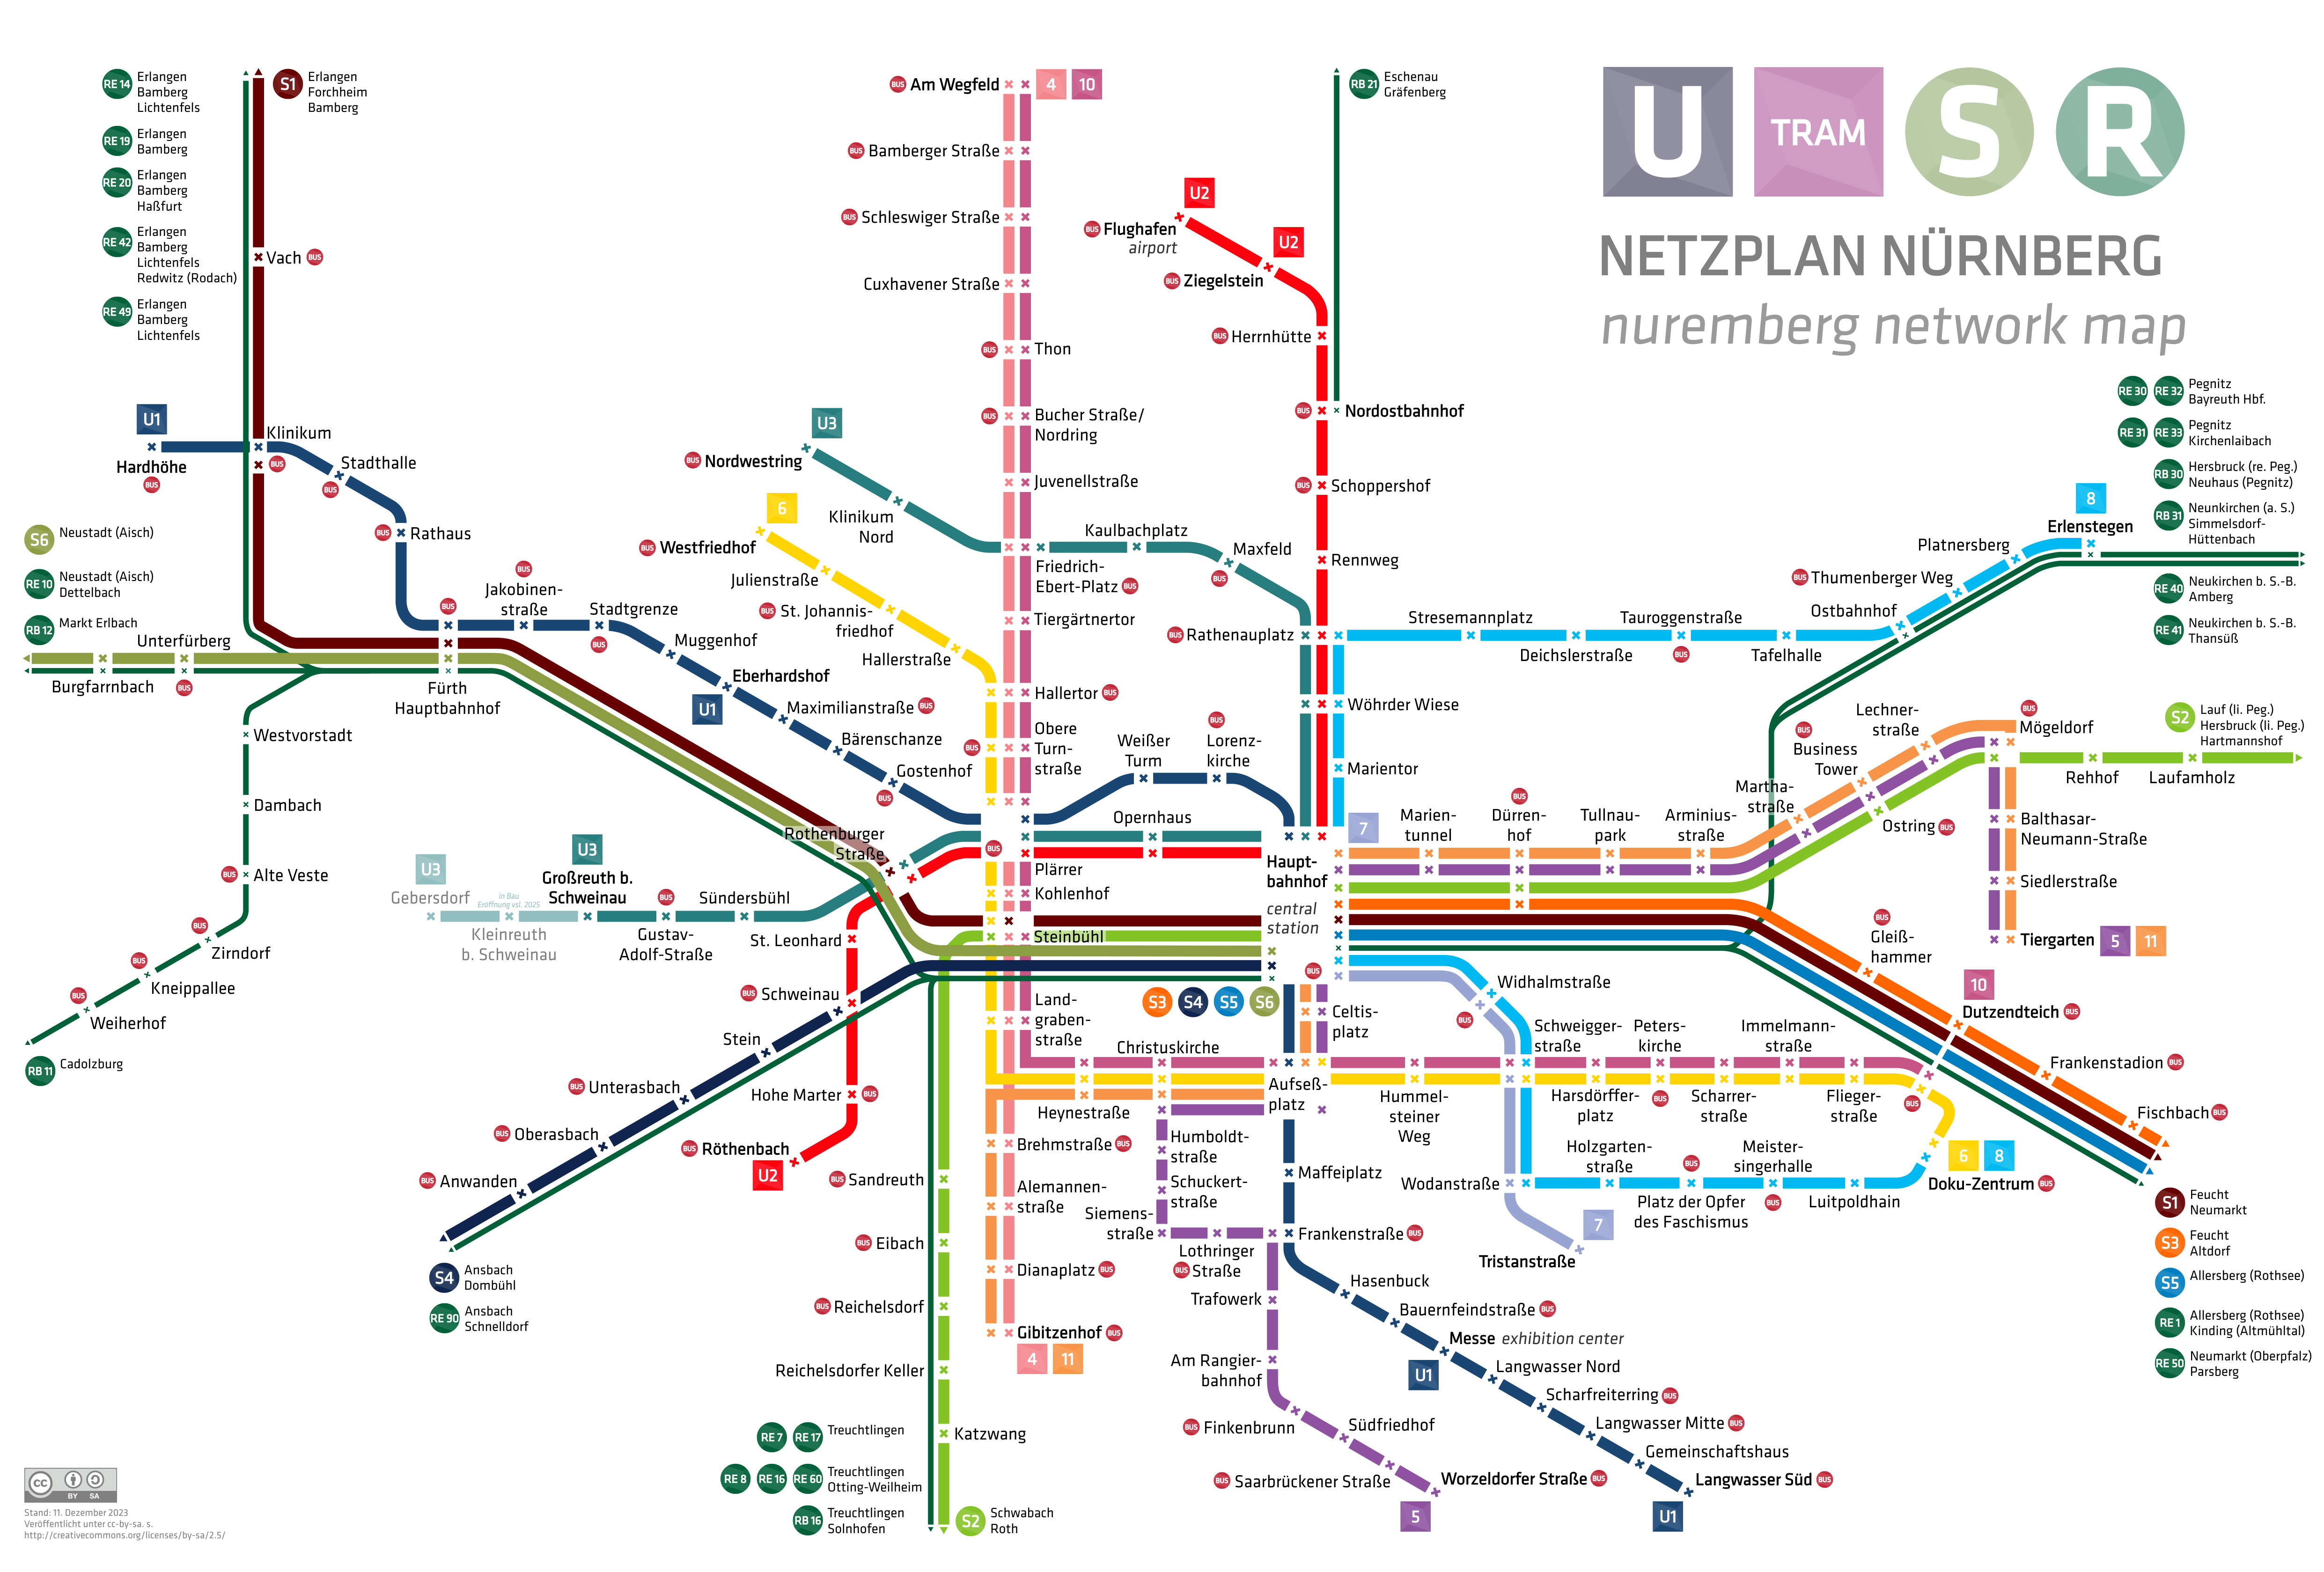
With that data in hand, we can pull out some information into a table. For each city, let us try to compare the population within 500 square kilometers (the ‘local’ population) against fixed-route transit ridership within that area and total transit ridership. The populations come from this Google Sheet from the Part 1 post. I select only those transit systems that are primarily within the 500 square kilometer area. Minnesota’s light rail fits the bill (though both Blue and Green line extensions won’t…food for a future article!); the Metro Transit bus network extends outside this area, but almost all of the high ridership routes are within it.
Fixed transit consists of subway, light rail, trams, trolley-bus, and Brisbane’s dedicated BRT tracks. The ‘Rides/Pop’ columns in the table below is average number of annual rides per resident of the ‘local pop’ area.
| City | Local Pop | Fixed Rides | Fixed Rides/Pop | Total Rides | Total Rides/Pop |
| Minneapolis | 1041000 | 23.8 | 23 | 81.1 | 78 |
| Calgary | 1047000 | 88.0 | 84 | 157.5 | 150 |
| Brisbane | 982000 | 70.0 | 71 | ||
| Ottawa | 907000 | 4.2 | 5 | 134.5 | 148 |
| Zurich | 991000 | 268.0 | 270 | 305.0 | 308 |
| Nottingham | 1050000 | 16.4 | 16 | 67.4 | 64 |
| Sheffield | 935000 | 12.6 | 13 | ||
| Mannheim | 881000 | 205.0 | 233 | ||
| Stuttgart | 1095000 | 174.9 | 160 | 364.9 | 333 |
| Antwerpen | 966000 | 128.9 | 133 | ||
| Nuremburg | 891000 | 168.1 | 189 | 227.9 | 256 |
Minneapolis’ ridership is generally below those of other cities, except the British ones. Total ridership is roughly half that of our two closest Canadian comparables; and light rail has about triple the ridership in Calgary. In continental Europe, ridership is even higher. To answer the motivating question, a city with a similar population distribution as Minneapolis could have light rail ridership 10 times higher, and total transit ridership four times higher, following the examples of Stuttgart and Zurich.
One fun thing to note is that every English-speaking city on this list fall below every non-English speaking city in both categories (fixed route and total ridership). Another fun thing to note is that of our 5 non-English speaking comparables, the primary language is German or Dutch in each: no Latin-language cities made the list! Perhaps there is a language barrier to higher transit? Time to embrace Minnesota’s Teutonic heritage!
Another useful comparison might be riders per track mile for urban rail systems:
| City | Riders | Track | Riders/Track |
| Minneapolis | 23.8 | 35.0 | 0.7 |
| Calgary | 88.0 | 60.0 | 1.5 |
| Brisbane | 70.0 | 27.0 | 2.6 |
| Ottawa | 4.2 | 8.0 | 0.5 |
| Zurich | 268.0 | 173.0 | 1.5 |
| Nottingham | 16.4 | 32.0 | 0.5 |
| Sheffield | 12.6 | 29.0 | 0.4 |
| Mannheim | |||
| Stuttgart | 174.9 | 130.0 | 1.3 |
| Antwerpen | 128.9 | 82.0 | 1.6 |
| Nuremberg | 168.1 | 37.1 | 4.5 |
Minneapolis is lower than any of the high use systems, but not by as much as in other metrics. If the city doubled its ridership per track mile, it would be on par with high use systems like Zurich, Stuttgart, Antwerp, and Calgary.
Upcoming, in the last post of this series, I will do a more extensive comparison of Minneapolis against two of the selected cities that have higher overall ridership: Calgary and Nuremburg.