Editor’s note: This article was originally published on November 7, 2024, in Catalyst, a publication of the University of Minnesota’s Center for Transportation Studies.
Pedestrians and bicyclists are the most vulnerable road users, and protecting them is a top priority for Minnesota transportation officials. The problem? Creating safe infrastructure for bicyclists and pedestrians requires a clear understanding of how they’re using the transportation system.
Although the Minnesota Department of Transportation (MnDOT) monitors bike and pedestrian traffic flows at 25 locations throughout the state, a large-scale count would be difficult and cost prohibitive. To address this challenge, University of Minnesota researchers are turning to increasingly available “big data” to estimate pedestrian and bicycle flows in a cost-effective way.
“Technologies like Bluetooth and GPS have made new data sources available that can be leveraged to get a good estimation of travel data,” says Center for Transportation Studies scholar Raphael Stern, assistant professor in the University of Minnesota’s Department of Civil, Environmental and Geo- Engineering. “The data sources are becoming richer as more people use smart devices, and [this data] can be extracted inexpensively compared to manual data collection.”

These new data sources offer promise for estimating bicycle and pedestrian counts, but since they are relatively new, their accuracy is unknown. For example, spatial quality and coverage can vary because of network service differences between urban and rural areas. In this project, researchers set out to create a method that combined mobile-sourced data with a trip behavioral model to correct errors and accurately estimate average daily bicycle and pedestrian traffic flows.
The MnDOT-sponsored project began with a literature review examining the use of crowdsourced mobile data to estimate and forecast bicycle and pedestrian traffic. Next, researchers combined the pedestrian and bicycle travel data collected at MnDOT monitoring sites with mobile data sources such as StreetLight and Strava Metro. They also incorporated the OpenStreetMap dataset, which contains mapping information collected through aerial imagery, GPS devices and field maps.

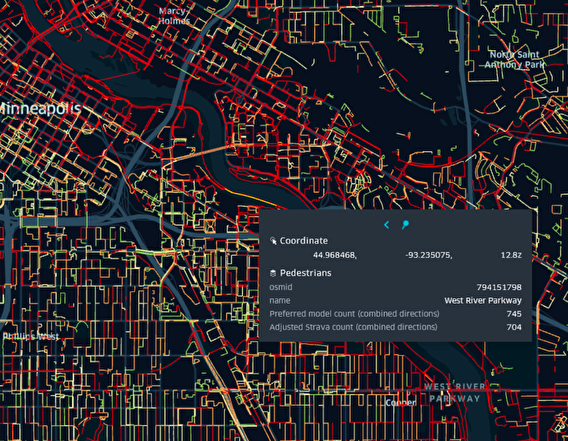
The dataset was then used to create route-choice and trip-distribution models to estimate average daily bicycle and pedestrian traffic. The data was calibrated with monitored baseline traffic counts in the Twin Cities area, then used to produce interactive visualized maps showing estimated annual average daily bicycle and pedestrian travelers on each road segment in the Twin Cities network.
Though existing mobile data sources proved somewhat limited in producing accurate bicycle and pedestrian traffic estimates, the data visualization tool provides a solid basis from which to improve and expand.
“This project was a great starting point to understand how to use mobile data for estimating bicyclist and pedestrian traffic, including how to combine it with our monitored data to produce more accurate results,” says Suzanne Scotty, a planner with MnDOT’s Pedestrian and Bicyclist Data Program.
Currently, MnDOT is using the visualization tool to get rough estimates of bicycle and pedestrian traffic in the Twin Cities area. In the future, additional research could further improve the tool’s accuracy, enabling it to support infrastructure decisions. MnDOT will also consider updating the travel trend system and expanding the visualization from the Twin Cities area to the entire state.
Photo at top: 2013, Creative Commons license 2.0
