
Editor’s Note 1: While Streets.mn editorial staff has reviewed this article for clarity and adherence to our submission guidelines; the data interpretations, specific “diagnoses,” and conclusions presented herein are those of the individual contributor. They do not necessarily reflect the official positions or endorsements of Streets.mn as an organization. Our goal is to provide a platform for community-led analysis of the Rethinking I-94 project to foster informed public dialogue.
Editor’s Note 2: This article is intended to be a primer on the Rethinking I-94 project, and explain necessary background information. If you know about the history of I-94, the Rethinking I-94 alternatives and what a Draft SDD and Tier 1 EIS is, I’d suggest you skip Part 1 and head to Part 2 publishing soon.
The Minnesota Department of Transportation (MnDOT) is proposing to dismiss the community-preferred At-Grade alternatives from the Rethinking I-94 project, a decision based only on traffic forecasts. Traffic forecasting is a valuable part of the planning toolkit, which can show possible future events that we need to prepare for. That doesn’t mean the forecast is always right.
MnDOT is taking comments on the current phase of the project until March 23.
The decision to dismiss the At-Grade alternatives has been criticized by, among others, the Minneapolis City Council and senior staff at Minneapolis Public Works.
Untangling Forecasts
I have spent the past few weeks trying to understand how MnDOT made quantitative forecasts, and what the limitations of those methods are. I found that basic details, like the method of calculating certain values, were buried in appendices to appendices. Other numbers, like the implausibly narrow uncertainty windows on certain metrics, were not explained at all. I’ve diagnosed three major issues that damage the credibility of Rethinking I-94.
Diagnosis 1: Undue Certainty
MnDOT talks about the future with the language of “will” and “would,” and does not accurately account for the limitations of predictions. This is out of line with advice given by traffic forecasting experts in 2009, who recommended that agencies should acknowledge “the inherent uncertainties in the modeling process.”
Diagnosis 2: “Industry Standard” is a Low Standard
MnDOT spokesperson Ricardo Lopez said in an interview with Streets.mn that the safety evaluation — one of the reasons for rejecting the At-Grade alternatives — was done following “industry standard” practices also used in previous MnDOT projects. However, every prediction in the safety evaluation is a point estimate, a single number based on a single set of input assumptions. The same is true of the forecasts used to evaluate vehicular mobility. This means it isn’t possible to see whether a change in, for example, gas prices or transit fares, might change the comparison between scenarios. In 2009, the same forecasting experts recommended that agencies make a “sensitivity analysis using ranges to show the variation in traffic forecasts with changes in the various inputs.”
Diagnosis 3: It’s hard to be objective about events that haven’t happened yet
Former MnDOT commissioner Margaret Anderson Kelliher made a commitment to community members to study non-freeway alternatives, according to Lopez. Only two of 12 alternatives in the project are non-freeway designs. The main advantage of removing the freeway is land use change–the opportunity to return part of the 366 acres occupied by the freeway to the community for homes, businesses, and parks. MnDOT isn’t considering this advantage at all.
Lopez said that “MnDOT does not make land use decisions,” although land use impacts would be considered in the next phase of the project.
In a MnDOT survey, residents of the area near I-94 preferred the At-Grade alternatives by a narrow majority and opposed the other new designs by wide margins. The selection process at this stage means that hard cutoffs on values predicted by traffic forecasting override all other concerns, including the expressed preferences of residents.
The 2009 report cautions against this kind of planning, explaining that “the use of forecasts to justify policy decisions results in a reversal of cause and effect, where present decisions are based on predictive future events… The philosophical, institutional and methodological nature of modeling makes it extremely difficult to predict future conditions in an unbiased manner.” The experts suggest that changes to the way modeling is conceptualized might help the results not only be more transparent and trustworthy, but more accurate. They give the example of “backcasting,” where modelers start by expressing the numerical goals of the project and then model to find out what paths are available to reach that desired future.
The 2009 report has been an important source for me to understand how (in)accurate past traffic forecasts in Minnesota have been. The report also contains a wealth of suggestions on how to make the best use of forecasts that are known to be uncertain, based on a literature review and interviews with forecasting professionals. I was surprised to see how little MnDOT seems to have followed that advice–because MnDOT was the agency that published the report.
I found that MnDOT’s I-94 plans are based on a series of invalid assumptions and inconsistent standards, and they appear to be the work of an agency that does not really seem to be interested in rethinking I-94. In Part 2 of this series, publishing soon, I will go through the most bafflingly inconsistent part of the project, the safety evaluation of the design alternatives.
The History of I-94
In order to build I-94, MnDOT forcibly displaced the residents of over 700 homes and 300 businesses in Saint Paul’s Rondo neighborhood. Displaced residents in Rondo were mostly black, were not consulted on the project, and were not adequately compensated. In Minneapolis, “formerly redlined areas comprise 17% of Minneapolis’ land but include 48% of the total miles of freeway,” according to Minneapolis’s Racial Equity Framework for Transportation. I-94 is an economic and community dead zone for seven miles where city blocks used to be, and this disenfranchisement can be traced to ongoing racial inequality in the Twin Cities. Former MnDOT commissioner Charles Zelle apologized for the freeway, saying “we would never, we could never, build that kind of atrocity today.”
The Current Phase of Rethinking I-94
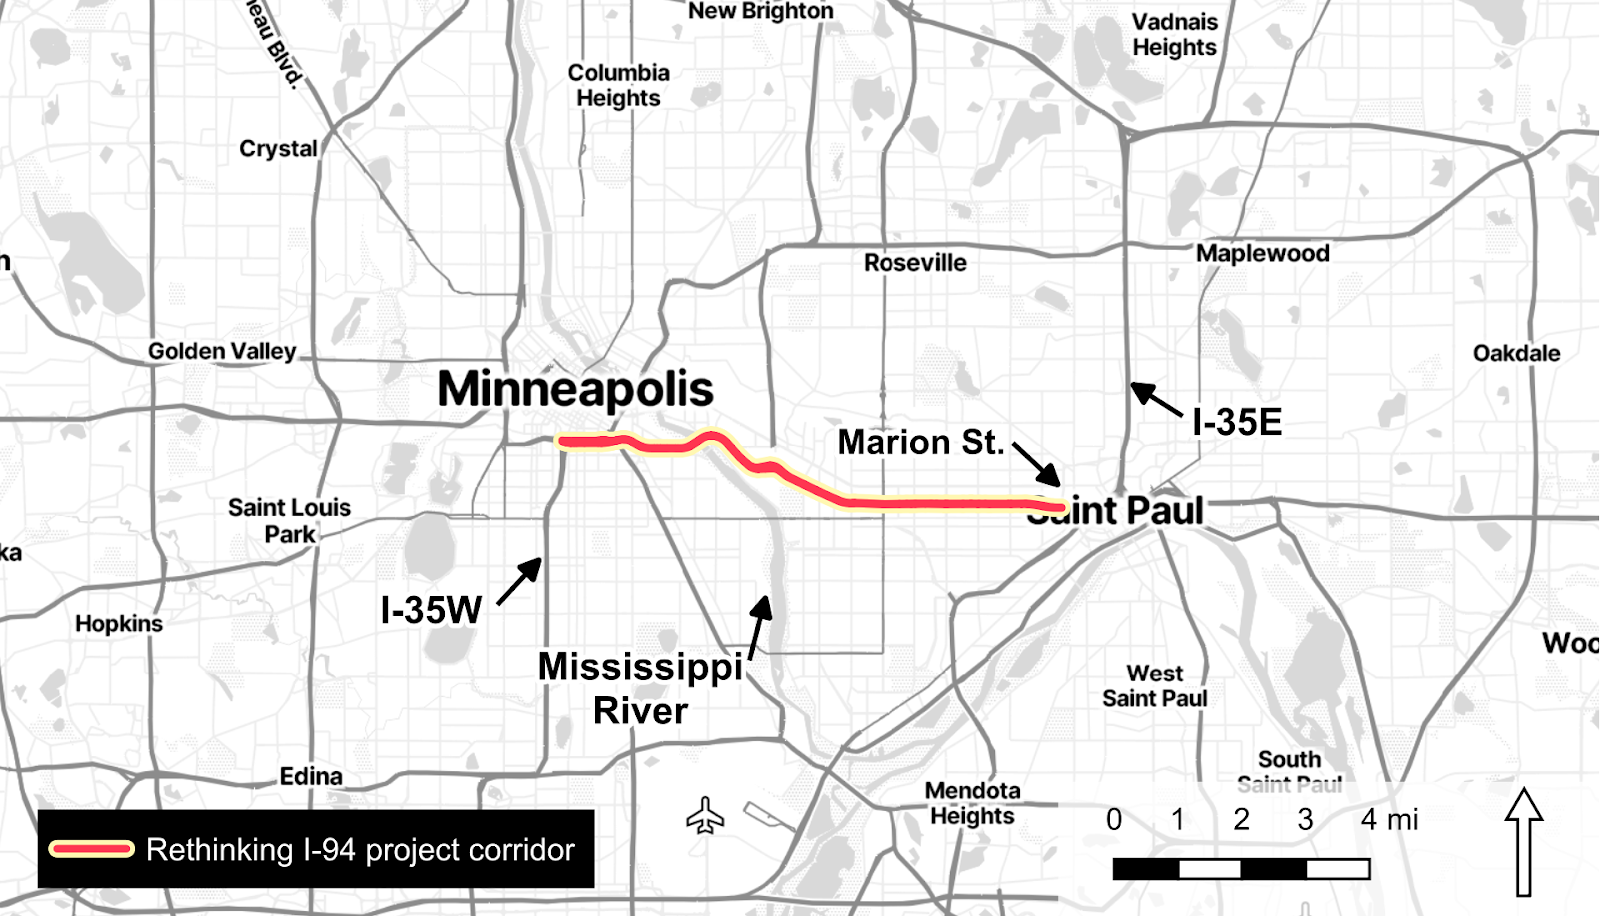
Rethinking I-94 covers about seven miles of freeway between I-35W in Minneapolis, and Marion Street in Saint Paul. The affected neighborhoods include Seward, Union Park, Midway, and Rondo. The area has some of the worst air quality in the Twin Cities, and the freeway is a clear split in what was once a cohesive neighborhood. Within a half mile of the freeway corridor, 28% of residents do not commute by car, and 21% do not have access to one, but at the same time, the freeway is an important transportation link for many community members. A little over 400,000 people make a trip on some part of the corridor every day. A majority of these trips originate and terminate within a mile of the corridor, and the most common trip duration is about 5 minutes. I-94 functions like a supercharged arterial road for people to get around the Twin Cities.
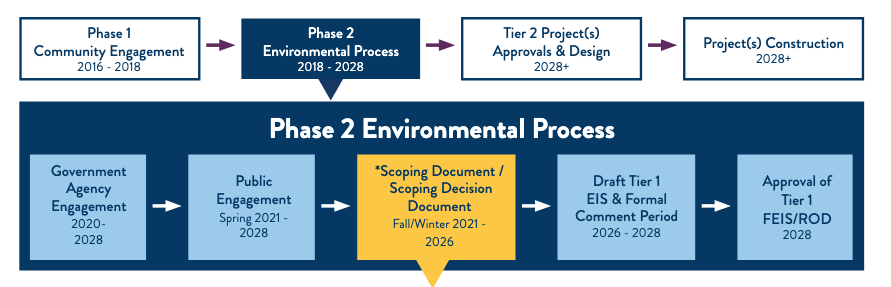
Currently, MnDOT is preparing to begin federal and state environmental impact studies. The first step of this process is scoping–choosing the project alternatives that will move forward to detailed study. MnDOT produced their Draft Scoping Decision Document (SDD) at the end of 2025, and it is currently open for public comment until March 23. The alternatives that make it through the scoping phase will then be studied in a Tier 1 Environmental Impact Study (EIS), which will lead to the choice of the final design for the project. A decision to dismiss an alternative now is a decision to exclude it from further study.
The design alternatives include three options which are more or less the same as the current design and five families of new options. I’d encourage everyone to go look at the pictures on MnDOT’s website, but a quick summary of the alternatives and MnDOT’s recommendations is:
— No Build: [Retained by default]: a baseline to compare other alternatives against
— Maintenance A: [Dismiss]: makes minor improvements to No Build
— Maintenance B: [Retain]: restores wide shoulders along the entire 7 mile corridor, which would be used by express buses
— At-Grade A&B: [Dismiss]: fills in the I-94 trench and replaces it with a surface road, similar to what existed before the freeway was built. A and B options refer to different BRT alignments with likely 3 stops along the 7 mile corridor.
— Local/Regional Roadways: [Dismiss]: reduces freeway access points and expands the current frontage roads, creating separated lanes for trips within the area and longer distance trip
— Reduced Freeway: [Retain]: reduces the freeway to three lanes. Includes a managed lane which is also used for buses with between 0 and 3 stops along the 7 mile corridor.
— Reconfigured Freeway: [Retain]: expands the freeway to four lanes for the entire 7 mile corridor, but converts one lane to a managed lane which would be used for buses with between 0 and 3 stops along the 7 mile corridor.
— Expanded Freeway A&B: [Dismiss]: adds at least one extra lane to the freeway. A and B options refer to different lane configuration options, with either a managed lane with buses allowed or express buses in the shoulder.
The Alternative Evaluation
The SDD is spread across multiple PDF documents. Six of them contain information that is relevant to this series. I will refer to them by descriptive titles throughout for clarity, but I’ve made a few abbreviations for the ones I will be referring to often.

The ultimate product of the SDD is a scoring matrix that compares the alternatives across 20 criteria. Based on the scores, MnDOT recommends which alternatives should be retained for further study and which should be dismissed. The alternatives all received a mix of positive and negative scores, but the various criteria are not weighted equally.
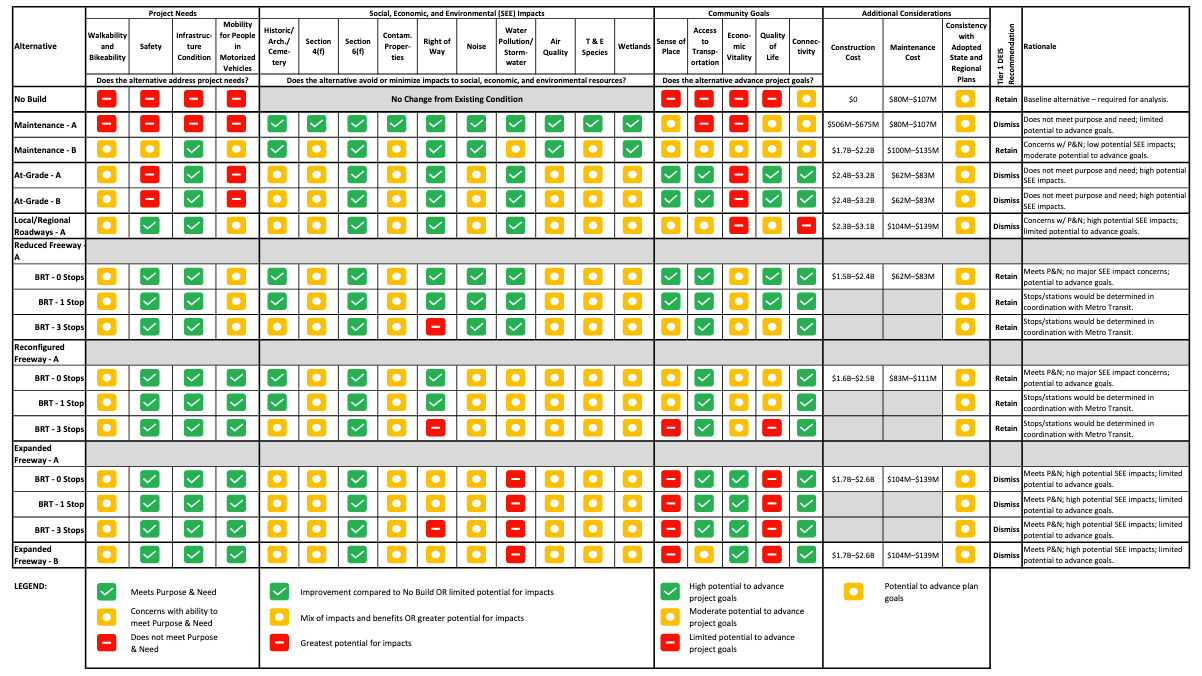
This matrix is available in multiple forms with different levels of context. In the main body of the Draft SDD (main SDD), what you see is what you get; there is little discussion of the cutoff points between the different scores or the magnitude of differences between the alternatives. MnDOT has also shared a version online, again with little context on what the criteria actually mean. Records obtained by a Freedom of Information Act (FOIA) request from Our Streets, who were not involved in producing this report, show that a reviewer from the Metropolitan Council thought this table should have more context. MnDOT responded that the context would be added as an appendix.
Appendix C: Scoping Alternatives Evaluation (SAE) includes some information on the thresholds between scoring, and summary level information about how the alternatives performed on each criterion. The SAE still doesn’t include any explanation of how numerical data was calculated. Some numerical data is also missing or does not match what is in the Evaluation Matrices appendix to the SAE. Explanations of most numbers can be found in Appendices C and D to the SAE: the Traffic and Transit Analysis, and the Safety Analysis. There are still a few numbers which don’t match across all of the documents, and one set of values that I could not find any explanation for.
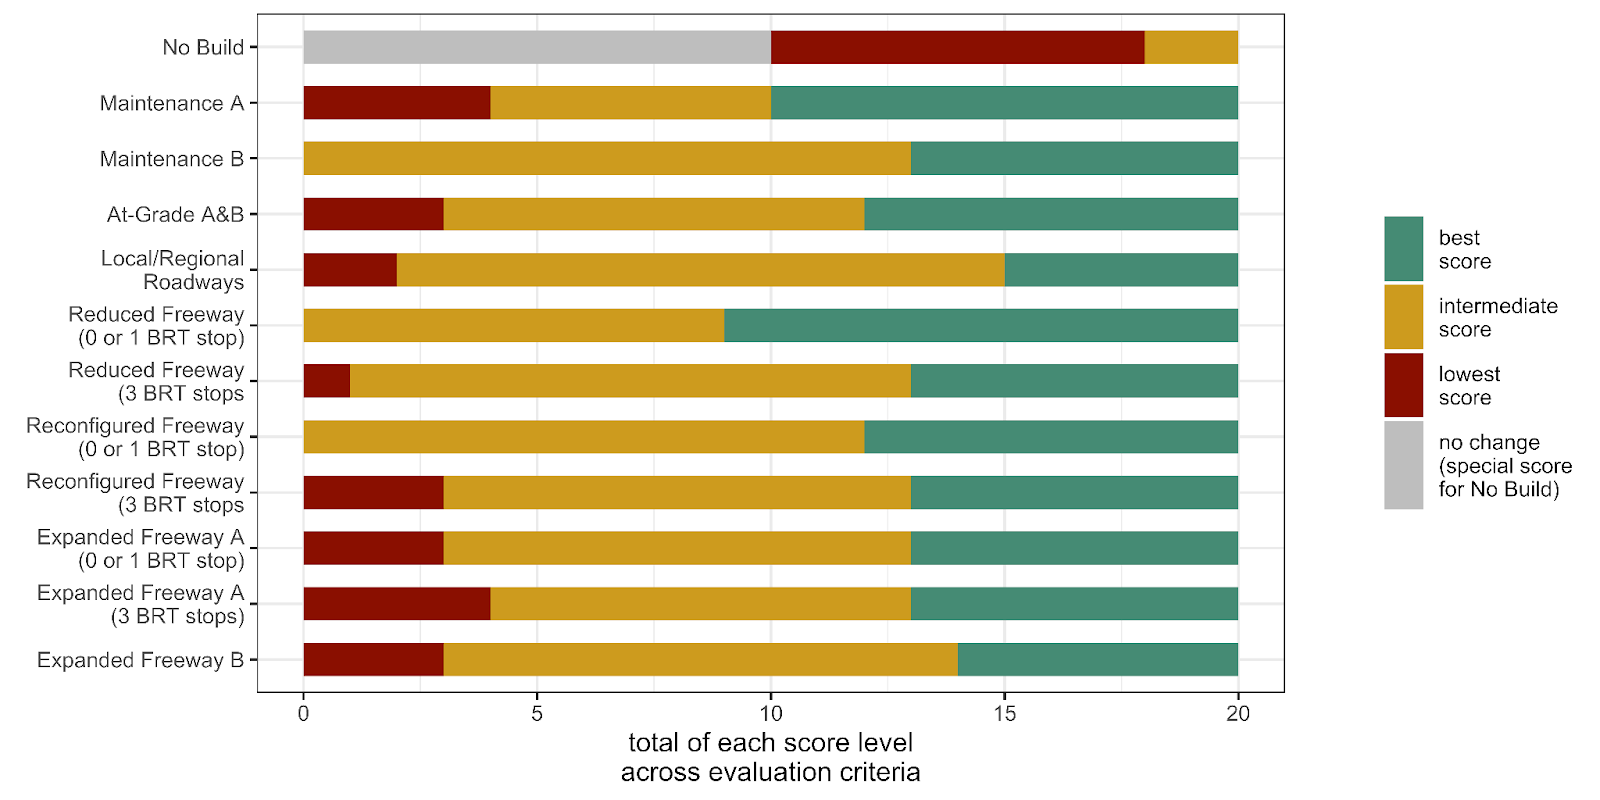
For a faster view of how the alternatives scored across categories, I made a stacked bar chart showing the count of each score level for each alternative. However, the evaluation is split into four tiers of analysis: Purpose and Need; Social, Economic, and Environmental (SEE) Impacts; Community Goals; and Other Considerations. This means that some green scores count more than others.
MnDOT chose to dismiss alternatives that have a “fatal flaw.” This term is not defined anywhere in the Draft SDD, but it seems to be fulfilled with one failure to meet a Purpose and Need criterion or multiple negative scores across SEE Impacts and Community Goals. Based on the alternatives recommended to advance for further study, some compromise on SEE Impacts, Community Goals, and Other Considerations is acceptable. For the decision to eliminate the At-Grade alternatives, only Purpose and Need is relevant, as At-Grade received mostly good or neutral scores on the other categories.
The Purpose and Need categories are:
- Improving comfort, mobility and risks for people walking, bicycling and rolling
- Addressing aging infrastructure
- Safety for people in motorized vehicles–cars, freight and transit
- Mobility for people in motorized vehicles–cars, freight and transit
For each Purpose and Need (P&N) category, there are three possible scores: Meets P&N, Concerns with ability to meet P&N, and Does not meet P&N. The other tiers of evaluation have different and inconsistent scoring levels.
Improving comfort, mobility and risks for people walking, bicycling and rolling
MnDOT did not evaluate safety or comfort for pedestrians and bicyclists at the SDD stage, so all alternatives received a score of Concerns with ability to meet P&N. MnDOT won’t consider comfort and safety until the next stage, once they’ve eliminated the At-Grade options. None of the alternatives at this stage have plans for something like a greenway, identifying places where new crossing points are necessary, or putting pedestrians on the I-94 bridge across the Mississippi.
Despite the lack of design detail, at least the At-Grade options do seem different from the others in this category. A letter sent to MnDOT from the Minneapolis Departments of Public Works and Community Planning and Economic Development, expressed, “it is questionable to give the At Grade options an orange ‘Concerns with ability to meet Purpose and Need’ designation for walkability and bikeability when a primary feature of both At Grade options are new pedestrian and bicycle facilities… The addition of pedestrian and bicycle facilities inherently creates new conflict points in an urban environment, where the majority of pedestrian and bicycle facilities must cross intersections. It will be a hard sell to the public to state that new bicycle and pedestrian facilities are inherently less walkable or bikeable due to new conflict points especially when the existing conditions, in many instances, is a lack of pedestrian and bicycle facilities or substandard facility designs.”
A commenter from the City of Saint Paul, in the Our Streets FOIA document also requested that “walkability/bikeability as concepts should include “comfort” of walking and biking.” MnDOT responded that “to [their] knowledge, there is not an evaluation measure accepted by FHWA [Federal Highway Administration] that measures the more subjective aspects of comfort for people walking and biking.”
This raises the question of why MnDOT put this category in P&N at all, if they weren’t planning to design for it or study it seriously–or apparently even allowed to do this.
Addressing Aging Infrastructure
All of the alternatives received a score of Meets P&N for Addressing aging infrastructure, except for No Build and Maintenance A. These alternatives would defer maintenance on certain infrastructure.
Safety and Mobility for People in Motorized Vehicles
The alternatives differ on the scores for Safety, and Mobility for motorized vehicles. The At-Grade alternatives were scored as Does not meet P&N in both of these categories. Both categories were quantitative comparisons based on a single traffic modeling run, although the mobility analysis used ten metrics calculated from the model, a subtable as big as the entire SEE Impacts table. The model is up-to-date and informative, but MnDOT’s interpretation methods are inconsistent and lead to some issues.
For safety, MnDOT did not adequately consider the uncertainty associated with future predictions. The predictions suggest that none of the alternatives would improve safety, and some might worsen safety conditions, but that the differences between alternatives in the key metric would be less than 5%. The chance that the forecasts are precise enough to confidently differentiate between these small predicted differences is vanishingly small, and it’s impossible for MnDOT to know the accuracy of the prediction ahead of time. In my opinion, all alternatives should have received the same score in MnDOT’s evaluation, but a better option would be to use a qualitative evaluation method. You can read more about this in Part 2.
For mobility, it was obvious ahead of time that surface roads would move fewer cars than a freeway. The At-Grade options are actually the only alternatives that are predicted to substantially reduce the amount of driving–a goal shared by Minneapolis, Saint Paul, and MnDOT, due to the costs of driving in infrastructure, crashes, and pollution. The At-Grade alternatives were designed to create a benefit for the community which was split by I-94, through returning land for homes and businesses. MnDOT did not consider these potential land use change benefits of the At-Grade alternatives. Lopez explained that, “while transportation and land use are inherently linked, land use planning is the responsibility of local units of government.” MnDOT is also now overriding the wishes of community members and commuters, who did not like the alternatives that remain in consideration. MnDOT should not have led the community to believe that At-Grade alternatives were in serious consideration if they were not prepared to accept a trade-off on mobility. For a closer look at some questionable aspects of the mobility analysis and my thoughts on how MnDOT could make the project more responsive to community input, take a look at Part 3.
At-Grade Failed One Community Goal: “Economic Vitality”
An important note is that MnDOT also gave the At-Grade alternatives the red score for the Community Goal of Economic Vitality. While this phrase may create the image of a neighborhood with thriving businesses, it in fact measures the opposite: the ability to leave the community by car to get to work elsewhere. This metric is a count of the jobs accessible in 30 minutes by car, which is a different way of stating the information on traffic speeds that was considered as part of the Mobility evaluation. While access to jobs is important, this method is subject to all of the same uncertainty as the traffic modeling itself, but handles uncertainty more or less the same way that the safety evaluation does–the subject of Part 2. Without knowing about the businesses that might be established on a future I-94 corridor with a reduced roadway footprint, it’s also an unfair comparison.
Public Comment Deadline is Approaching
If you want to provide your own comment on the Draft SDD, you can visit MnDOT’s comment page to see instructions on how to write a good comment. Then, you’ll fill in an online form or mail your comments on paper. Remember to get any comments submitted by March 23. The deadline has already been extended once, so this is really the last chance!
Lopez provided the statement “The Rethinking I-94 project is currently seeking public comments on two scoping documents: the Scoping Document/Draft Scoping Decision Document (SD/DSDD) and the state Environmental Worksheet (EAW) — until Monday, March 23. The scoping documents and project website contain the evaluation of the alternatives and the series of evaluation criteria used to make recommendations for the Tier 1 EIS.